As Us National Debt Hits $30 Trillion, Higher Borrowing Costs & Negative Real Yields Will Make It Harder to Finance
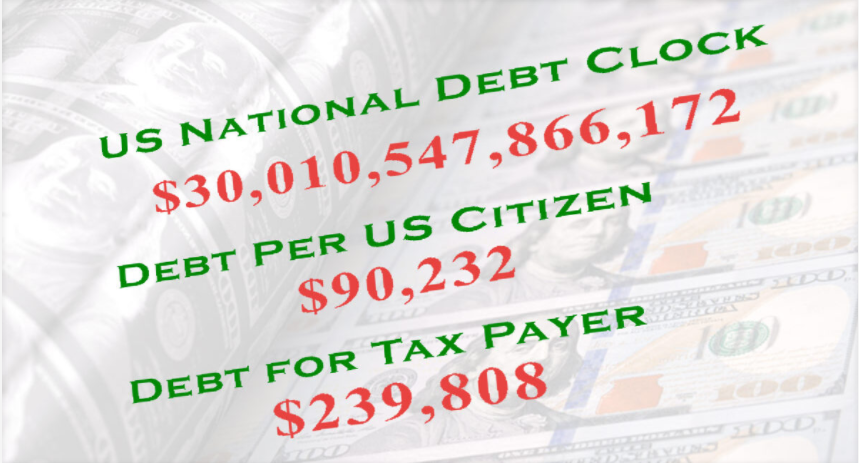 The United States reached a new milestone this week, but it’s nothing to be proud of. For the first time, the national debt hit 30 trillion dollars.
It used to be that a billion dollars was a lot of money, now government programs worth hundreds of billions are routine, and a spending package isn’t considered of much consequence unless it tops $1 trillion, which if you were wondering, is written with 12 zeros, i.e., $1,000,000,000,000.
The US Treasury Department published data on Tuesday saying that total public debt outstanding is now $30 trillion.
It’s worth breaking down this humongous pile of debt, to understand who it is owed to, how much interest is paid on it, and how the money that is getting us into debt is being spent.
The national debt explained
Essentially, the national debt is the amount of money the government owes its creditors, domestic and foreign. Because the US government usually spends more than it brings in, the debt continues to rise.
However let’s not confuse the debt with deficits. A fiscal deficit
Is registered when annual government spending, as set out in the federal budget, exceeds its revenues, which include income taxes, corporate and excise taxes. The national debt is simply the accumulation of annual deficits. Again it is the total amount the government owes its creditors.
To run a deficit, basically spending beyond its means, the US Treasury Department issues bills, notes and bonds. Those who have bought a piece of government debt are called Treasury holders; they could be domestic or foreign. Treasury securities are also sold to corporations, banks and other governments.
China and Japan are by far the largest buyers of US Treasuries. According to Statista, using data compiled by the US Federal Reserve and the Treasury Department, as of September 2021, foreign countries held $7.55 trillion in US Treasury securities. Of this total, Japan owned $1.3 trillion and China owned $1.05 trillion. In a previous article we observed the growing disinterest of foreign investors in buying US Treasury debt; with US banks, the Fed and consumers left holding the bag for the federal government’s continued issuance of debt.
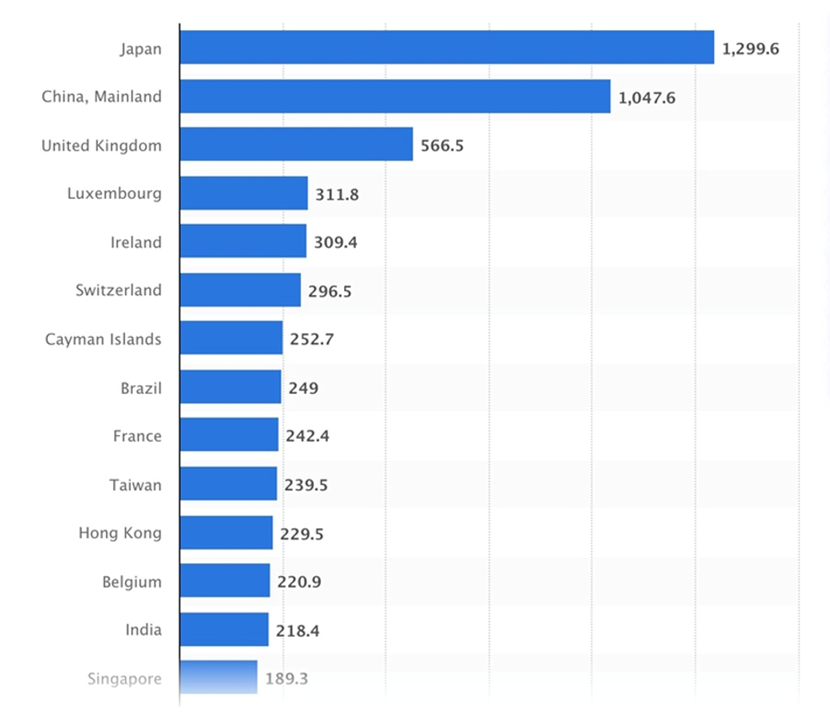 Major holders of US Treasuries, as of September 2021. Source: Statista
But it isn’t only Treasuries that make up the $30T national public debt. The federal government currently owes $23.5 trillion in debt to creditors and $6.5 trillion to itself. The latter is debt held in Social Security and other government trust funds. According to the Peter P. Peterson Foundation, an organization focused on addressing the country’s fiscal challenges, debt to creditors increased by $1.5 trillion over the last year alone.
Now that we understand who owns the debt, what about the money that is being borrowed? How is it spent?
According to Investopedia, the top expenses in 2021 were Medicare, Medicaid and other healthcare programs ($1.4 trillion); Social Security programs and disability pensions ($1.T), and $752 billion earmarked for the US Defense Budget (nuclear weapons, special forces and pensions are not in the DOD budget).
Debt growth
Between corporate bailouts to deal with the Great Recession of 2008-09, and covid-19 pandemic relief spending, government borrowing has massively accelerated. In December 2007, just before the financial crisis, the national debt was $9.2 trillion.
In the late 2000s to mid-2010s, the recession combined with President Bush’s tax cuts, and continued spending on wars in Iraq and Afghanistan, caused the debt to balloon. Under the two terms of the Obama administration, the federal debt to GDP ratio rose from 43% in Q4 2008 to 75% in Q4 2016, an increase of 73%, states Investopedia.
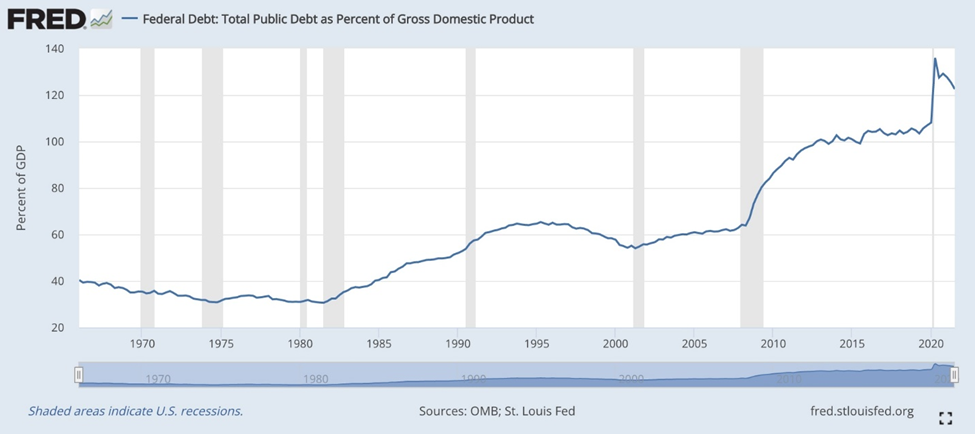 US debt to GDP ratio, historical
President Trump, as most students of economic history are aware, was no fiscal hawk. In 2016, when he was handed the keys to 1600 Pennsylvania Avenue, the national debt stood at nearly $20 trillion. When he left, in Q4 2020, it was at $27.7T.
Before covid, Trump presided over a sharp increase in the debt due to his 2017 tax cuts, CNN states.
In fact the national debt has grown substantially over the past three years, regardless of who has been in the Oval Office. Since the end of 2019, it has surged about $7 trillion.
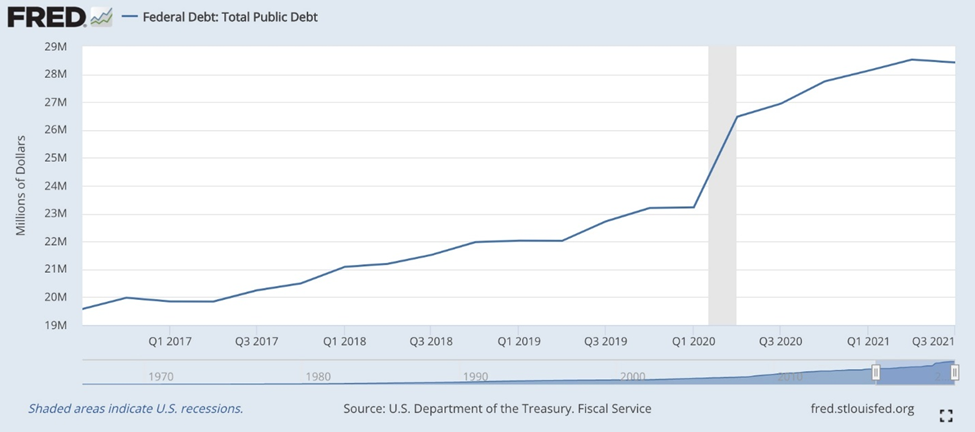 Total public debt
A country’s ability to pay off its debt is dependent on how large the debt is as a proportion of its economy, i.e., its debt to GDP ratio. Some, including us at AOTH, worry that excessive government debt levels will impact economic stability, with ramifications for the dollar, the ability of the US government to pay its bond holders, and regular citizens, when spending on important social programs is crowded out by higher debt servicing costs.
There are five ways of reducing the debt: higher taxes, less spending, debt restructuring, monetization of debt, and most drastic, a default. Over the past several years, by far the most popular option has been debt monetization.
Also known as quantitative easing, this is a way for the government to “create” money it doesn’t have. It does this by borrowing the money from the public by issuing Treasury bonds. These bonds are then purchased by the US Federal Reserve, which creates new bank reserves that banks can use to lend to borrowers. QE is basically a shell game that allows the free-spending politicians to “print money.”
Interest on the debt
As mentioned the government generates a budget deficit when it spends more in a year than it collects in revenues. The US government finances its borrowing by issuing bonds. As an incentive, the government offers to pay bondholders back their principal (the amount loaned) plus interest, at the end of the term. This is known as the yield. Longer-dated bonds, like the US 10-year Treasury, 20-year and 30-year, usually pay higher yields than shorter-term bonds, which are less risky. They mature, and can be redeemed, within a year, whereas long-term bonds lock the buyer in.
Remember this, it will become important later on in the article.
In 2021, the federal government brought in revenues of about $4 trillion. However, the deficit in fiscal 2021 was $2.8 trillion, meaning they spent $2.8 trillion more than they collected.
We have no idea what 2022 revenues will be, but we have it on good authority that this year, and for the next nine, the annual budget deficit will be around $1.3 trillion.
(The Congressional Budget Office (CBO) and the Committee for a Responsible Federal Budget (CRFB) — both reliable sources — project a deficit of $1.3T in 2022, and every year until 2031. Meaning Federal debt is projected to be an astounding US$43T)
Back to Investopedia, we learn that, as of Oct. 20, 2021, the interest paid for the 2021 fiscal year (which ended on Sept. 30), was $562 billion. This is the accumulated monthly interest payments on US Treasury notes and bonds; foreign and domestic series certificates of indebtedness, notes and bonds; savings bonds; Government Account Series (GAS); State and Local Government Series (SLGs); and other special-purpose securities.
This is the interest the government had to pay bondholders, on all the various debt instruments that were issued in the preceding years.
Compared to the $30T national debt, it doesn’t seem like a lot. But if interest payments keep trending up, and they likely will, because the Fed is targeting at least three quarter-point interest rate hikes this year (3 X 0.25% = 0.75%), and possibly seven, the payments could soon be closing in on $1 trillion.
Nearly $600 billion in interest last year was accumulated at rates close to 0%. But rates are going up, and so will the interest payable to bondholders on newly issued and rolled over debt.
How much is difficult to say. Here’s what we know: the $562B in interest was generated at quite low bond yields, as the chart below for the US 10-year shows.
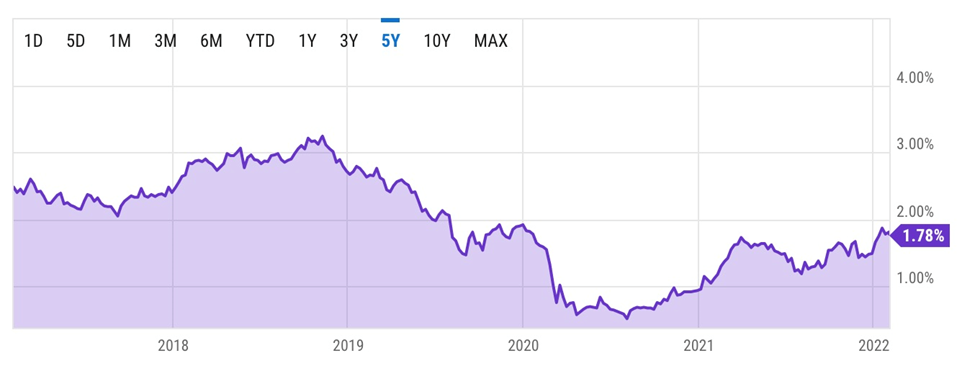 10-year Treasury rate. Source: YCharts
In March, the Federal Reserve might raise rates by 50 basis points (+0.50%). Another 25 basis points could follow, bringing the Federal Funds Rate to between 0.75 and 1%. That may seem small, but it’s a quadrupling of the current 0.25-1% range.
Gold and real interest rates
If US inflation keeps rising, but interest rate hikes are so far below that rise, you have negative real interest rates — the perfect condition for gold buying.
(When real interest rates (interest rate minus inflation) are low, at, or below zero, cash and bonds fall out of favor because the real return is lower than inflation. If you are earning 1% on your money from a government bond, but inflation is running at 7%, the real rate you are earning is negative 6% — an investor is actually losing purchasing power. Gold is the most proven investment to offer a return greater than inflation, by its rising price, or at least not a loss of purchasing power.)
Bond market and gold market observers keep a close eye on US Treasury yields, particular the yield on the benchmark 10-year note. This is because the 10-year serves as a proxy for other financial products, such as mortgage rates, and it also signals investor confidence. When there is low confidence in the economy, people want safe investments, and US Treasuries are considered among the safest. Demand for Treasuries bids up their prices and yields fall. Conversely, when confidence returns, investors dump their bonds, thinking they do not need to play it safe. This causes bond prices to sink and yields to climb. Bond yields also rise on inflation expectations.
Historically, we can see the inverse relationship between negative real interest rates and gold, by charting the gold price and the 10-year Treasury’s yield after inflation.
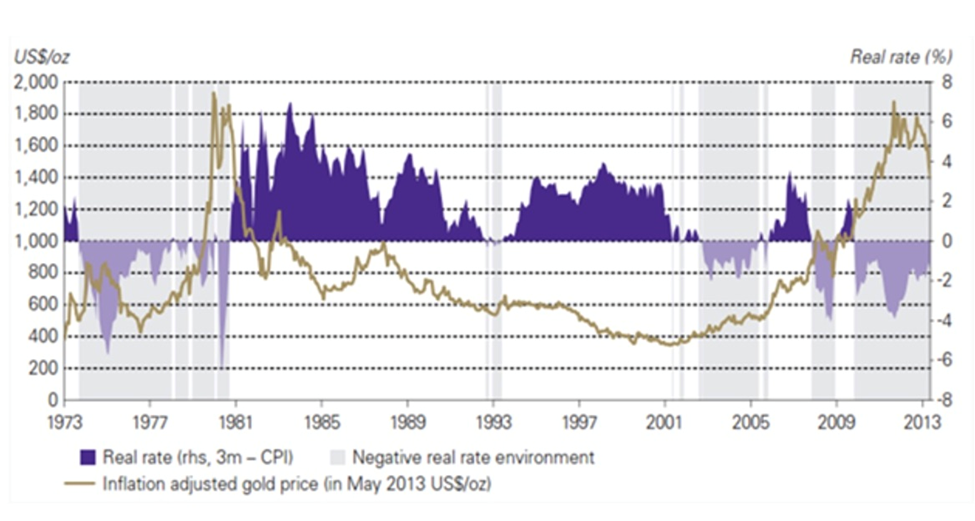 Historical real rate of inflation versus gold
In the FRED chart below, notice that the gold price between 2013 and 2020 never gets above $1,400/oz, corresponding to the period when the real yield on the 10-year is between about 0% and 1%. However, when real yields “go negative,” as they did around 2011-13, and in 2020, gold prices jumped.
2020’s 22% increase in the gold price was due to pandemic fears, combined with a low US dollar and plunging Treasury yields, causing real yields to go negative even though inflation stayed below 2%.
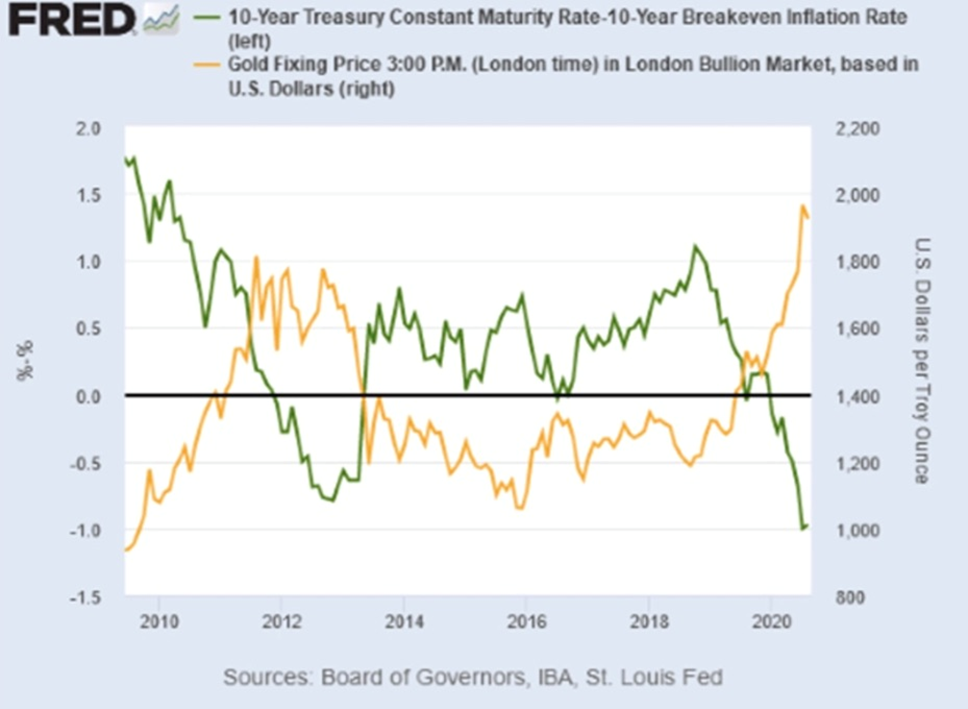 Gold prices jump when real yields “go negative,” as they did around 2011-13, and in 2020.
Conclusion
US inflation hit a 40-year high of 7% in December. To tackle it, the Federal Open Market Committee (FOMC) is looking at raising interest rates at each of its regular meetings this year — up to seven quarter-point increases. That would put the target range at between 2.75% and 3% by year’s end.
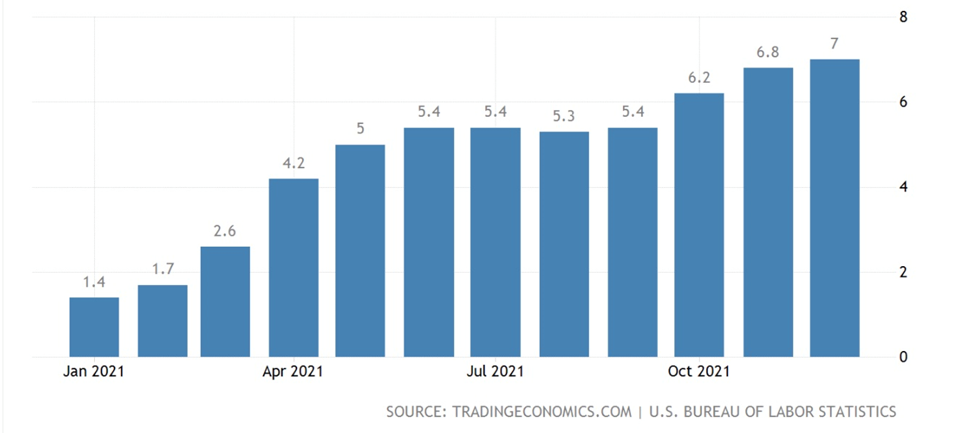 US inflation rate, CPI. Source: Trading Economics
But even if that happens, it still won’t be enough. Say the supply chain issues get ironed out and that takes care of half the current 7% rate of inflation, there will still be another 3-4% inflation (food, energy transition, wage spiral, and climate crisis) left to deal with. In other words, they need to go higher.
Unless the Fed “gets serious” about tackling inflation, bond buyers will continue to lose money on Treasuries, making them a poor investment. This may have been justified during the financial crisis, or the beginning of the covid crisis, when many investors saw them as the safest of the safe havens. They didn’t mind getting a 0% yield or even the yield going slightly negative, if it meant staying out of highly volatile, risky stocks.
This is no longer the case. The stock market may have come down a bit from 2021 highs, but it’s still up, historically, and higher than it was pre-covid.
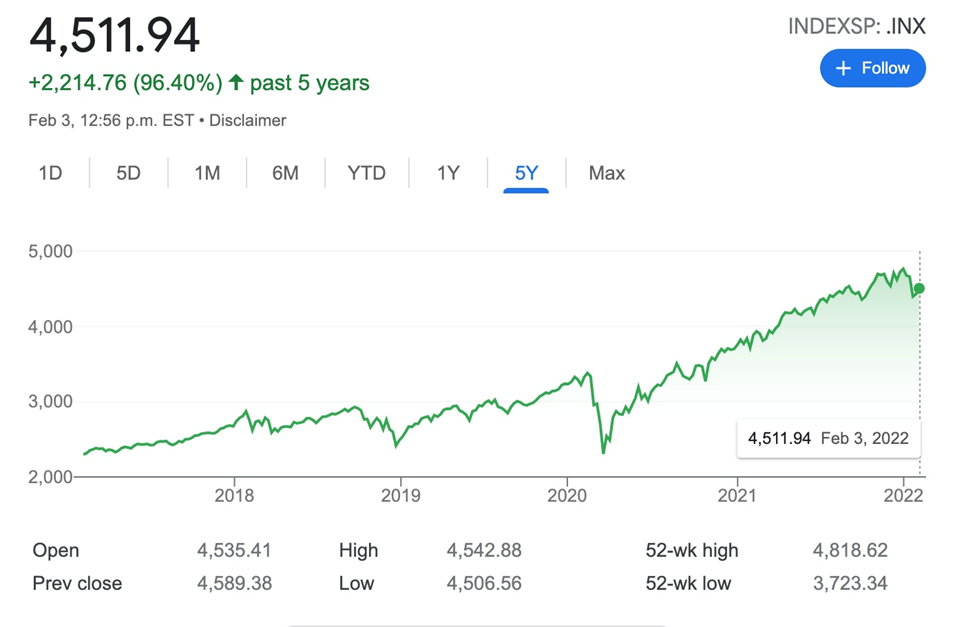 The S&P 500. Source: Google
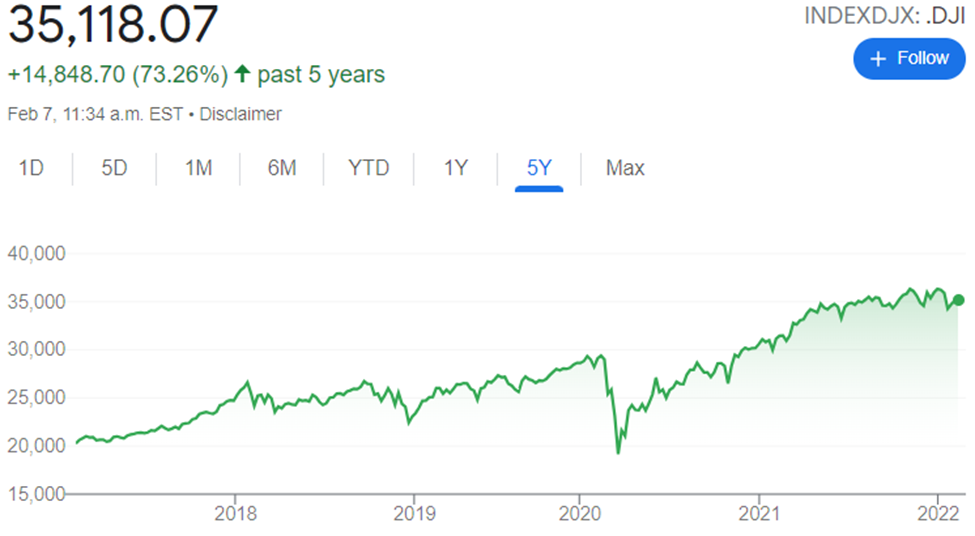 The Dow. Source: Google
We are no longer in panic mode, when investors feel they need to park their money in Treasuries.
The fact is nobody is going to want to buy US debt at 4% inflation, let alone 7% (real yields would still be negative). The Fed will continue to print money, buy bonds and keep interest rates below 1% for as long as it can — probably hoping that inflation will magically melt away — all of which is extremely positive for gold.
Unless they want to crash the stock market and kill consumer spending which is 70% of the US & global economy causing a severe recession.
Richard (Rick) Mills
aheadoftheherd.com
Legal Notice / Disclaimer
Ahead of the Herd newsletter, aheadoftheherd.com, hereafter known as AOTH.
Please read the entire Disclaimer carefully before you use this website or read the newsletter. If you do not agree to all the AOTH/Richard Mills Disclaimer, do not access/read this website/newsletter/article, or any of its pages. By reading/using this AOTH/Richard Mills website/newsletter/article, and whether you actually read this Disclaimer, you are deemed to have accepted it.
Any AOTH/Richard Mills document is not, and should not be, construed as an offer to sell or the solicitation of an offer to purchase or subscribe for any investment.
AOTH/Richard Mills has based this document on information obtained from sources he believes to be reliable, but which has not been independently verified.
AOTH/Richard Mills makes no guarantee, representation or warranty and accepts no responsibility or liability as to its accuracy or completeness.
Expressions of opinion are those of AOTH/Richard Mills only and are subject to change without notice.
AOTH/Richard Mills assumes no warranty, liability or guarantee for the current relevance, correctness or completeness of any information provided within this Report and will not be held liable for the consequence of reliance upon any opinion or statement contained herein or any omission.
Furthermore, AOTH/Richard Mills assumes no liability for any direct or indirect loss or damage for lost profit, which you may incur as a result of the use and existence of the information provided within this AOTH/Richard Mills Report.
You agree that by reading AOTH/Richard Mills articles, you are acting at your OWN RISK. In no event should AOTH/Richard Mills liable for any direct or indirect trading losses caused by any information contained in AOTH/Richard Mills articles. Information in AOTH/Richard Mills articles is not an offer to sell or a solicitation of an offer to buy any security. AOTH/Richard Mills is not suggesting the transacting of any financial instruments.
Our publications are not a recommendation to buy or sell a security – no information posted on this site is to be considered investment advice or a recommendation to do anything involving finance or money aside from performing your own due diligence and consulting with your personal registered broker/financial advisor.
AOTH/Richard Mills recommends that before investing in any securities, you consult with a professional financial planner or advisor, and that you should conduct a complete and independent investigation before investing in any security after prudent consideration of all pertinent risks. Ahead of the Herd is not a registered broker, dealer, analyst, or advisor. We hold no investment licenses and may not sell, offer to sell, or offer to buy any security.
[ad_2]
Source link
UMich Inflation Expectations Collapsed In December; Repuboicans Drive Surge In Sentiment

Debt Ceiling Fight Begins, McCarthy Dares the House to Get Rid of Him – MishTalk