Treasury Adds Another $94B in Short-Term Debt and $278B Overall

The Treasury added another $278B in debt during February. Similar to January, the Treasury stopped converting short-term to long-term, and instead increased Bills by $94B, larger than any other security type.
Debt issuance has fallen since the binge in December when the Treasury had to replenish its “extraordinary measures” stockpiles (government employee retirement funds). Still, issuance is relatively high.
Note: Non-Marketable consists almost entirely of debt the government owes to itself (e.g., debt owed to Social Security or public retirement)

Figure: 1 Month Over Month change in Debt
The next graph below shows the annual debt added. This view more clearly highlights the effort in 2021 to reduce Bills outstanding. This trend has clearly reversed in 2022. Further, debt issuance through February exceeds all issuance in 2017 and most years from 2002-2007.
Given the recent surge in tax revenues, it’s unlikely annual debt issuance will exceed 2020 or 2021, but it will most probably be elevated compared to pre-Covid years.

Figure: 2 Year Over Year change in Debt
The reason the Treasury actively reduced Bills outstanding, is the risk posed by having such short-term debt. The last time the Fed started hiking rates in 2015, annualized interest on Bills increased from $0 up to $60B in very short order.
The Fed spread the hikes over several years. Some market pundits see 7-10 hikes within the next 12-18 months! With the Treasury now adding to short-term debt, higher interest rates could prove deadly rather quickly.
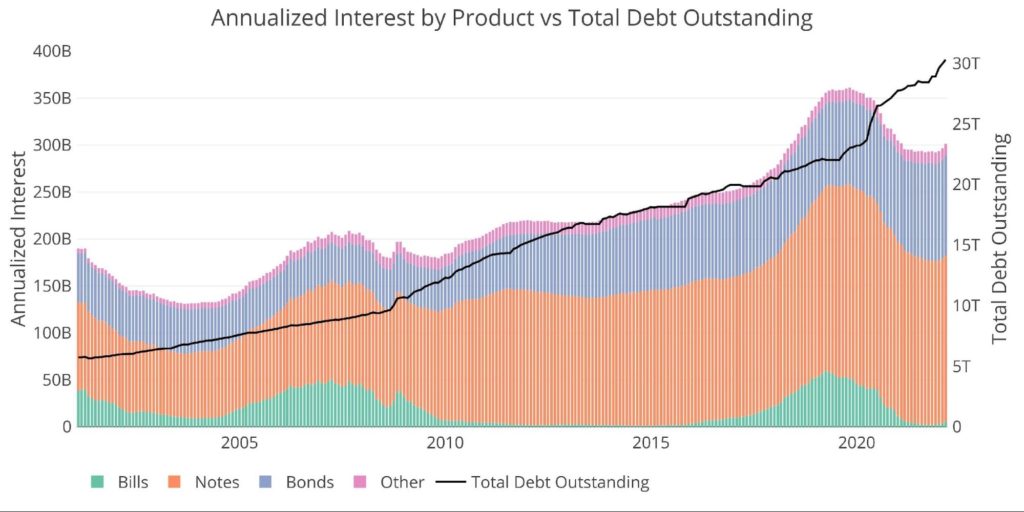
Figure: 3 Total Debt Outstanding
The Treasury knows the risks that lay ahead. This is why the cash balance sheet has rebounded so rapidly. Before Covid, it stayed consistently below $400B. It is now over $750B. The Treasury recognizes the need for an insurance policy, and cash is still “king” (for now).
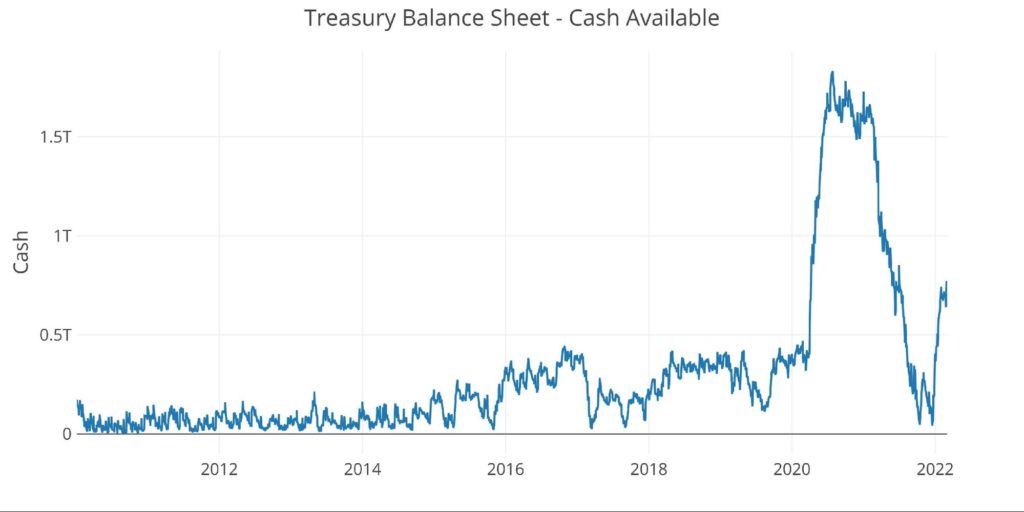
Figure: 4 Treasury Cash Balance
Digging into the Debt
The table below looks at the most recent month of debt issuance, compared to the previous month, and also the Trailing Twelve Month (TTM) average. More history is shown on the right comparing the last 3 TTM periods (the last 36 months). Some key takeaways:
- The total debt outstanding has reached $30.3T
- In the current month, debt increased across all categories
- Specifically, < 6-month bills went from averaging a decrease of $53B to increasing by $86B
- Notes were below the 12-month average across every maturity category
- Debt issuance over the last 12 months is 84.5% higher than the 12 months ending Feb 2020
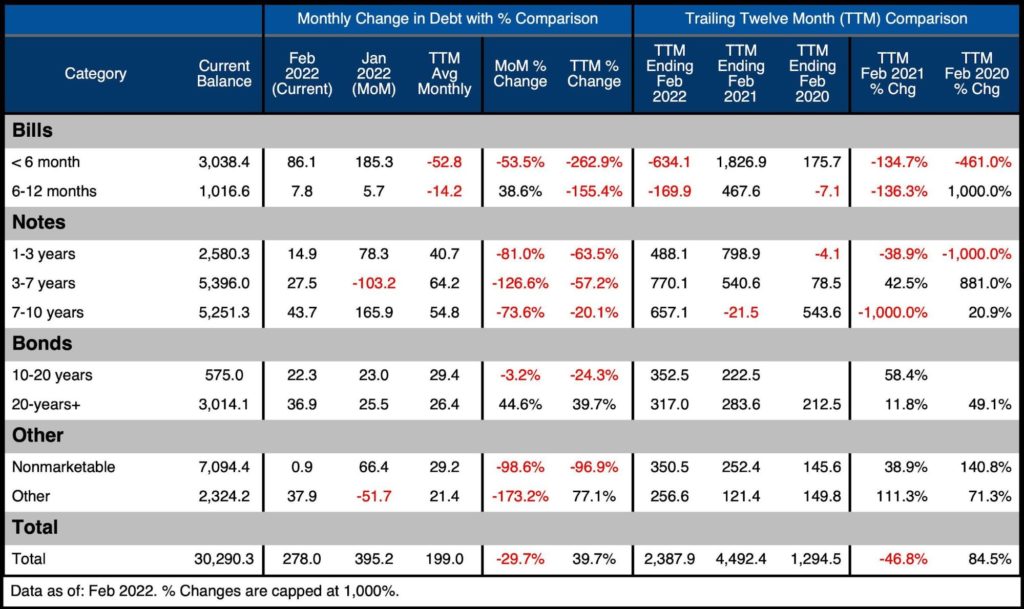
Figure: 5 Recent Debt Breakdown
Debt Rollover
Shorter maturities could prove devastating for the Treasury if interest rates were to rise (which the Fed is promising to do). The chart below shows that the Treasury is still rolling over $1T of debt per month!
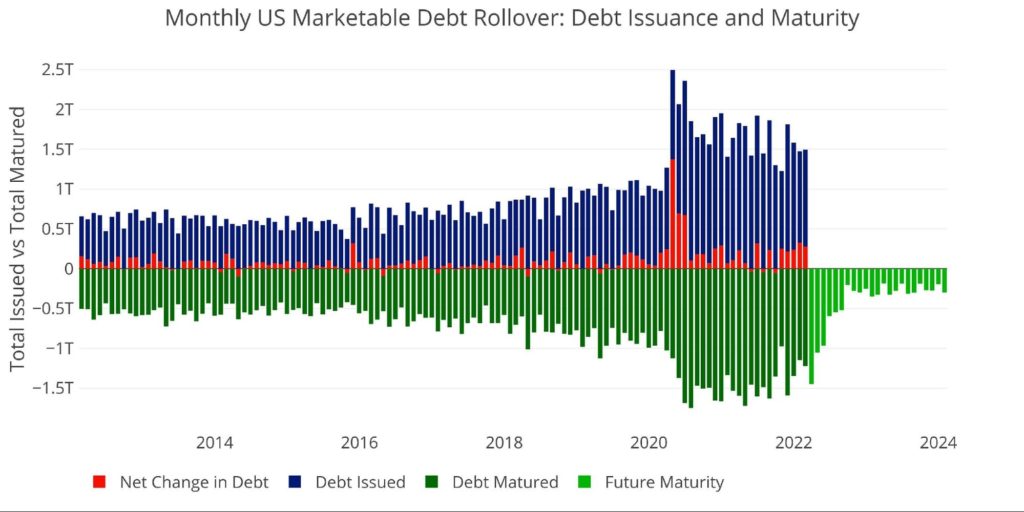
Figure: 6 Monthly Rollover
Note “Net Change in Debt” is the difference between Debt Issued and Debt Matured. This means when positive it is part of Debt Issued and when negative it represents Debt Matured
While it may look like the government is about to get relief with a lot of debt maturing in the coming months, most of the debt will be refinanced into short-term debt and the rolling will continue well above $1T.
T-Bills (< 1 year)
While demand for T-Bills may be well received by the market, it poses a risk to the Treasury. Each month almost 25% ($1T) is rolling over, and as the chart below shows nearly 100% rolls over within a six-month window. This means any Fed hike will be felt almost instantly in the Treasury Bill market. Each .25% rate hike will translate to $10B in additional annual interest payments within 6 months.
Said differently, if the Fed raises rates by 1% in 2022, the Treasury will owe an additional $40B a year in interest payments just on Bills.
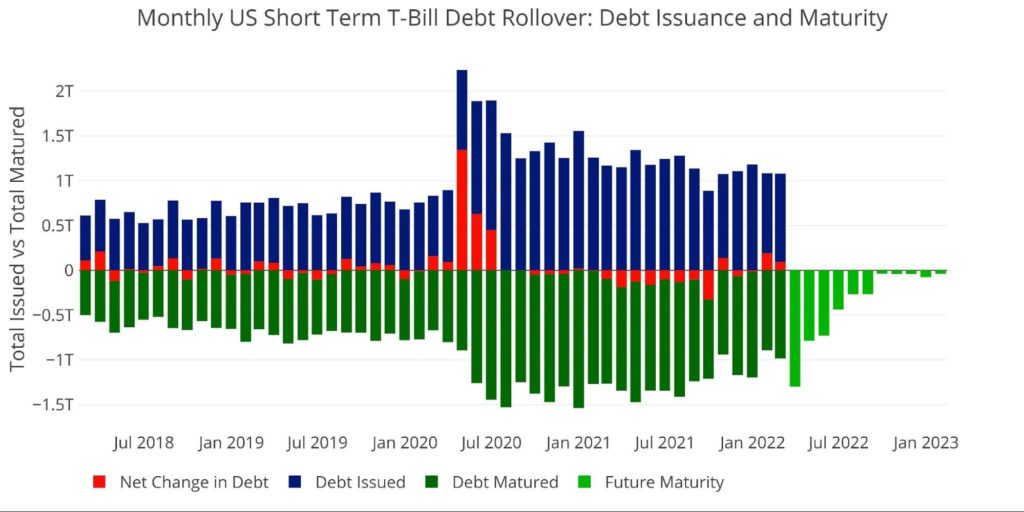
Figure: 7 Short Term Rollover
Treasury Notes (1-10 years)
Although the Treasury talks about taking advantage of low-interest rates to lock in expenses, it’s easier said than done. The plot below shows the Bid to Cover for 2 year and 10-year debt. Unlike Bills which range between 3-3.5, Notes are closer to 2.5.
The Treasury cannot flood the market with Notes because there wouldn’t be enough demand and interest rates would be pushed up. Factor in the Fed leaving the market, and the Bid to Cover will fall further, especially considering foreign governments are losing their appetite for Treasuries.
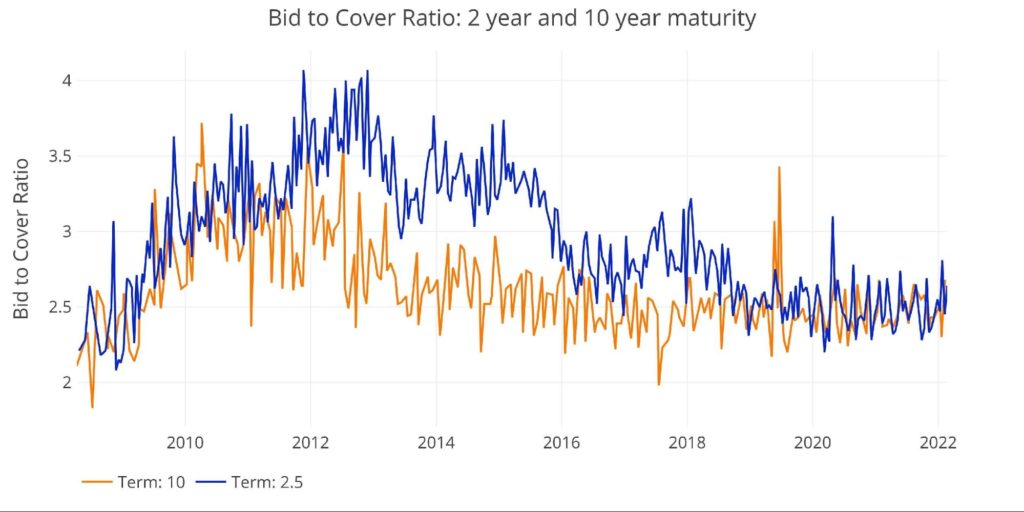
Figure: 8 2 year and 10-year bid to cover
Notes also have their own problem. While they have a longer maturity than Bills, it only buys relief for a couple of years. The chart below shows the annual rollover for Treasury Notes. As shown, the amount rolling over has picked up significantly in recent years.
2022 will be the largest year ever in Notes that need to be rolled over at $2.4T. This will be quickly beat in 2023 as nearly $3T in Notes will rollover. Remember, this is debt that already exists and needs to be refinanced. It does not include new debt issuance nor does it include any Quantitative Tightening by the Fed.

Figure: 9 Treasury Note Rollover
Interest Rates
Finally, a look at interest rates shows how the Treasury has been able to maintain low-interest payments despite a ballooning deficit. Unfortunately, rates have already started to move up before the Fed has started raising rates.
Even the three-month rates have started going up. Rates increased from 0.06% to start the year to 0.32%, reaching as high as 0.43% on Feb 14. Rates have come down as the Russia/Ukraine conflict has sparked a flight to safety. However, with inflation looking to hit 8% in the months ahead and the Fed starting to raise rates, it’s unlikely the mild pullback will last long.
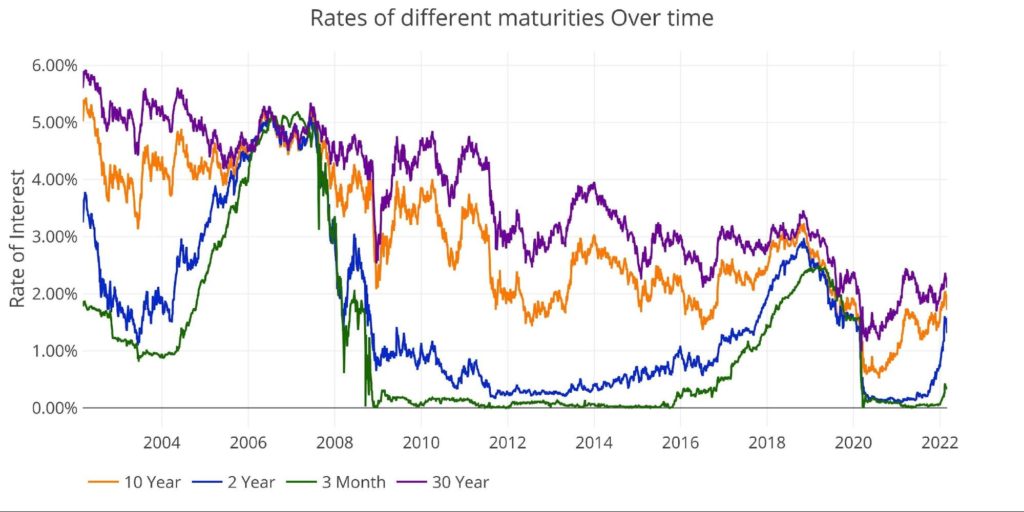
Figure: 10 Interest Rates
The spread between the 2 and 10-year can be seen below. At a spread of 0.36%, it is now the smallest it’s been since March 2020, right before the Fed dropped rates to zero. With the Fed now doing the reverse, it is very likely the yield curve inverts in the months ahead.
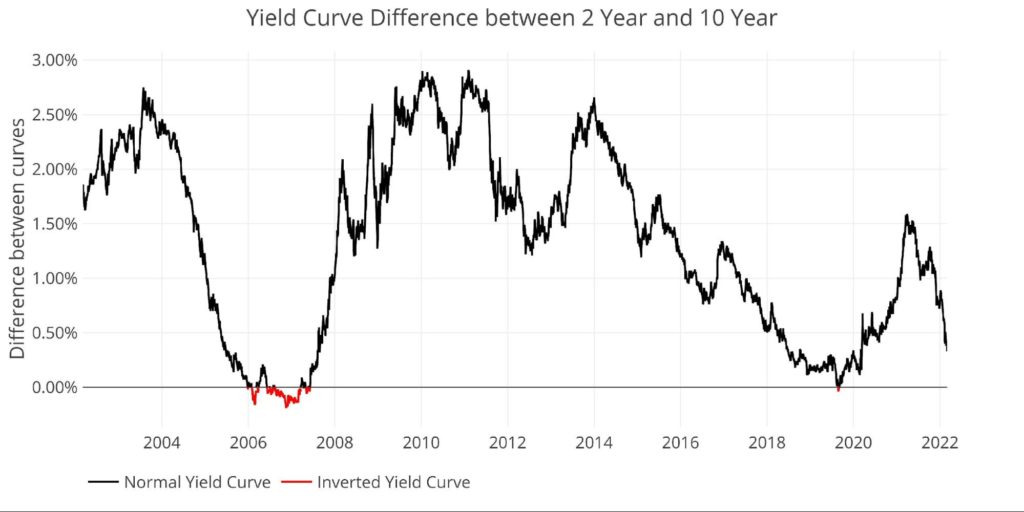
Figure: 11 Tracking Yield Curve Inversion
Historical Perspective
While total debt has now exceeded $30T, not all of it poses a risk to the Treasury. There is $7T+ of Non-Marketable securities which are debt instruments that cannot be resold. The vast majority of Non-Marketable is money the government owes to itself. For example, Social Security holds over $2.8T in US Non-Marketable debt. This debt poses zero risk because any interest paid is the government paying itself.
The remaining $23T is broken down into Bills (<1 year), Notes (1-10 years), Bonds (10+ years), and Other (e.g., TIPS). The Fed owns $5.7T, which also poses zero risk because the Fed remits all interest payments back to the Treasury. In the chart below, this debt is actually counted as being “held by the Public”.
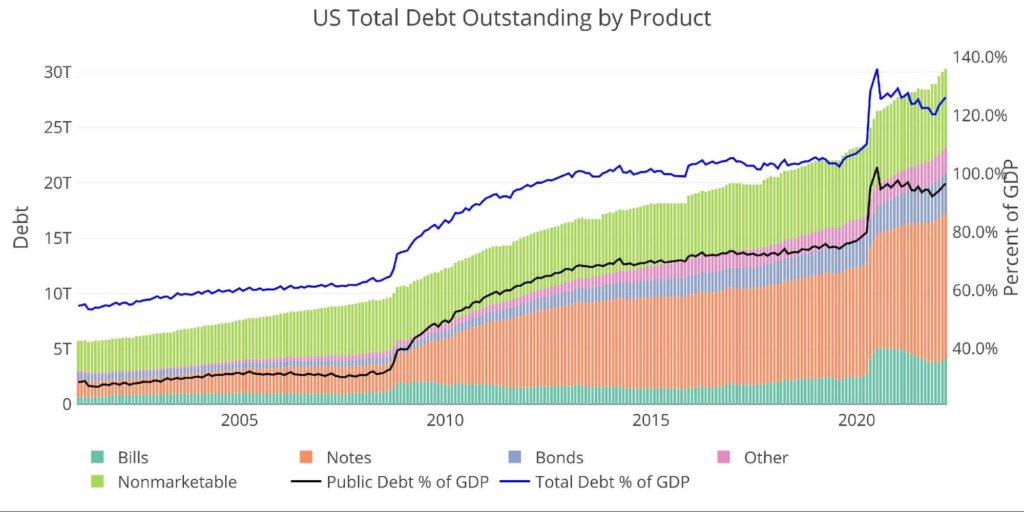
Figure: 12 Total Debt Outstanding
The chart below shows how the reprieve offered by non-marketable securities has been fully used up. Pre-financial crisis, non-marketable debt was more than 50% of the total. That number has fallen below 25%.
Another important thing to note is the slight increase in annualized debt. Two months ago, it was $292B but has climbed to over $301B. The Treasury is now on the hook for another $10B before the Fed has even started the rate hiking process!
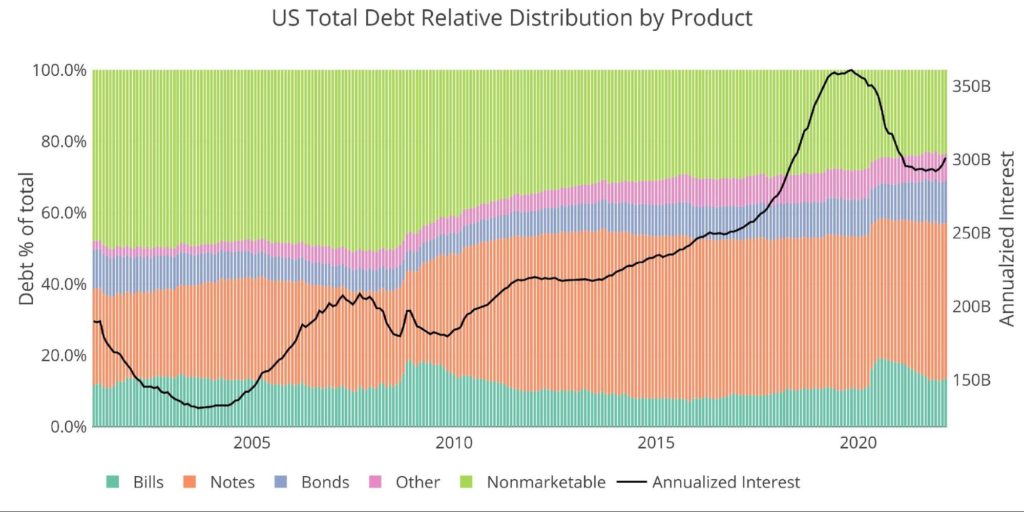
Figure: 13 Total Debt Outstanding
Historical Debt Issuance Analysis
As shown above, recent years have seen a lot of changes to the structure of the debt, with risk being brought forward up the yield curve. Looking at a longer historical period shows an even more stark picture of how dramatic the changes have been. The table below explains why “the debt hasn’t been a problem for decades”, but refutes the notion that it can hold true going forward without significant and continued intervention by the Fed.
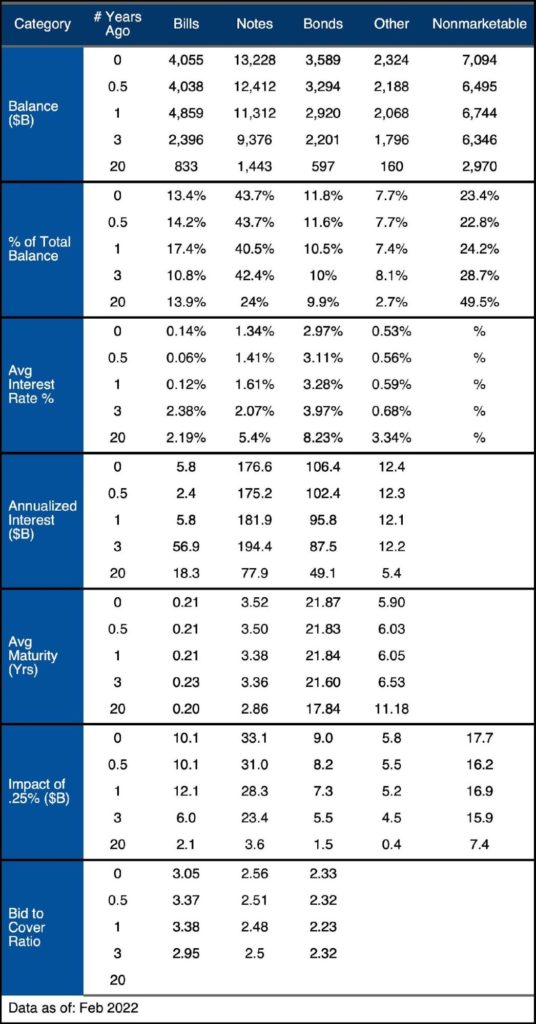
Figure: 14 Debt Details over 20 years
It can take time to digest all the data above. Below are some main takeaways:
- Notes have increased by $800B in 6 months
- Average rates on Bills have doubled in 6 months from 0.06% to 0.14%
- A .25% increase will increase payments on Bills by $10B within 6 months and increase payments on Notes by $33B within a few years
- Only 3 Years ago, these numbers were $6B and $23B
- If the Fed gets to 2% over the next year, as many are forecasting, payments will increase $80B on Bills and $264B on Notes within a few years
- Average interest on Notes has fallen to 1.34%, the Treasury is already refinancing Notes at higher rates
As explained above, if the Fed raises rates by even a modest 2%, interest on the debt will more than double in short order! Perhaps this is why the Treasury has gone back to issuing Bills, it has run out of room on all other instruments.
What it means for Gold and Silver
The Treasury is out of tricks. Interest rates have bottomed and the intra-government debt cannot keep up with debt issuance (not to mention at some point those bills will come due also – e.g., Social Security). While an increase in interest rates would take time to work its way through Notes and Bonds, the impact would be felt immediately in Bills. That being said, with Notes having an avg maturity of 3.5 years, it wouldn’t take long to feel the increase in Notes especially if the Fed had a prolonged fight against inflation.
Thus, the Fed cannot raise short-term rates and it needs to keep long-term rates contained. If the Fed had to hike rates above inflation to 8%, this would utterly devastate the Treasury’s ability to manage its debt load. Interest on Bills would increase by $320B in 6 months! Annualized interest on Notes could surge more than $1T within a few years! This would instantly cause a debt spiral to take hold.
The Fed has no choice. It can talk tough, but actually doing anything to fight inflation will destroy the Federal budget, not to mention the entire economy.
Data Source: https://www.treasurydirect.gov/govt/reports/pd/mspd/mspd.htm
Data Updated: Monthly on fourth business day
Last Updated: Feb 2022
US Debt interactive charts and graphs can always be found on the Exploring Finance dashboard: https://exploringfinance.shinyapps.io/USDebt/

Call 1-888-GOLD-160 and speak with a Precious Metals Specialist today!
[ad_2]
Source link

Florida becomes largest state to mandate personal finance education
Via Clever Tactics, Putin Gets His Way on Rubles for Energy Demand – Mish Talk