Viewing Potential US Employment Growth Through the Japanese Lens
In this article I’ll compare/contrast the US and Japanese demographics to explain why the US is far more “Japan-like” demographically than is typically acknowledged. I’ll show the decelerating population growth by age groups, leading to decelerating employment growth.
Two big takeaways:
1- The likely end of US employment growth as nearly all US employment growth over the past two decades has been driven by the growth among the 55 to 64 year-old cohort, whose population has now peaked and begun it’s secular decline. 65+ year old population growth simply doesn’t translate to significant jobs growth due to the rapidly declining participation rates past age 65. The only likely means to further employment growth are significantly higher immigration rates or significantly higher participation rates…
2- Speaking of higher participation rates…the great deviations (particularly since 2012) from long term norms among the Japanese female labor force (both among the 25-54 and 55 to 64 year-olds) should be very noteworthy.
Total Employees
Total employees, Japan & US, below. Japanese employment growth essentially ended in 1992 with only minimal fluctuations since. I’ll suggest that the same end of employment growth situation has taken place for the US as of 2020. Total US employees will likely fluctuate in this general range for the next decade or two.

25 to 54 year-olds (Core)
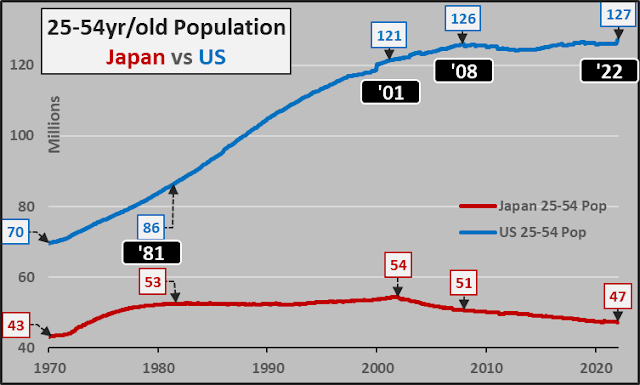
25 to 54 year-old Populations
Japan low population growth plateau from ’81 to ’01. Population declines since ’01.
US high growth from ’70 to ’01. Then decelerating until essentially no growth since ’08.
Employed 25 to 54 year-olds
Japanese core employment clearly peaked in ’00…the US has hit the triple peak in ’07, ’19, and likely soon again in ’22?

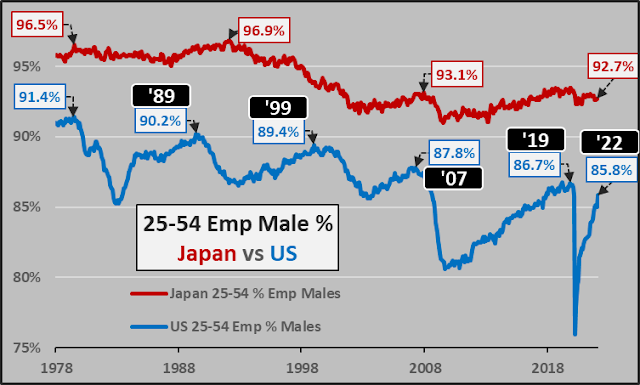
Male 25 to 54 Employment %
Japanese and American male core populations continue to have high participation levels, though both clearly in secular percentage decline over the decades.
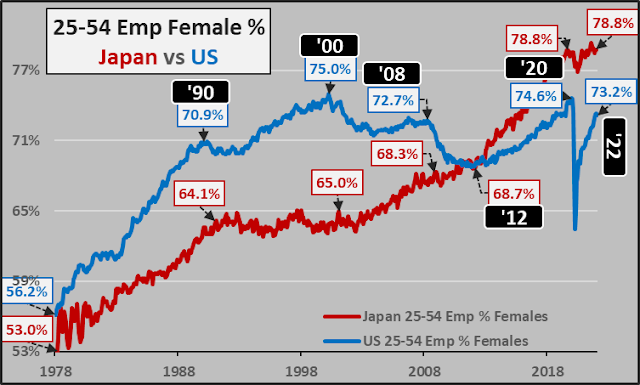
Female 25 to 54 Employment %
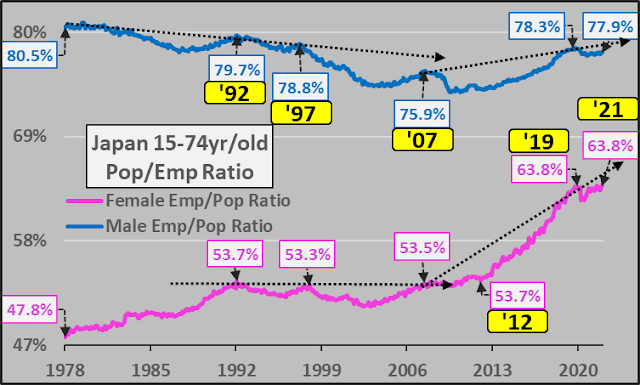
Japanese female participation levels are the story…shifting from trailing US female participation levels by 10% to 5%+ greater participation than US females! Why 2012? Not really sure…perhaps someone will be able to explain (but I’ll speculate below)!?!
55 to 64 year-olds (Pre-Retirees)
55 to 64 Population
Japan peaked in 2006 and in secular decline.
US peaked in 2019 and now rolling over.

55 to 64 year-olds employed
Japan peaked in ’07 and via far higher LFP rates, has avoided a far greater decline.
US likely to double peak (’19/’22) and begin rolling over.

55 to 64 Male employment %
Japanese male Pre-retirees seeing the greatest participation since WWII.
Essentially, only the slightest uptick in US male pre-retiree LFP.

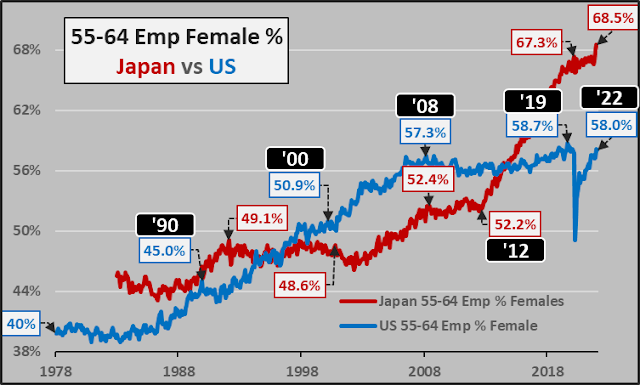
55 to 64 Female employment %
Obviously, the soaring female participation since 2012 has been key to Japan avoiding a far larger decline in total employment. A detailed report from Brookings regarding the rising Japanese female participation can be read here…Brookings. And while the rising Japanese female participation is primarily due to rising part-time workers at relatively poor wages, the sudden rationale for the spike isn’t exactly clear.
Looking at the widest possible Japanese labor force, 15 to 74 year-old male and female participation levels. Again, the spike in participation since 2012, particularly among females.
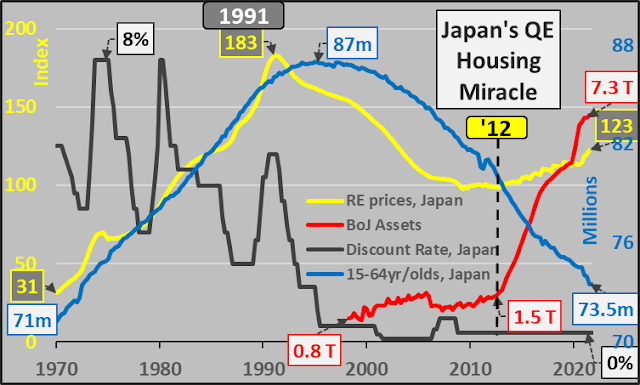
While I am no expert on the Japanese economy, I’m well aware of one correlation to the sudden spike in female participation…it’s the undertaking of BoJ QE writ large, unlike anything the BoJ had ever done before. The impact of this QE was a sudden turnaround in Japanese residential housing prices despite ongoing new supply and continued depopulation. However, no similar correlation has occurred thus far in the US…but something to keep in mind?!?
15 to 24 year-olds (Young Adults)
15 to 24 Population
Japan…down, down, down.
US young adult population has essentially not grown since 1980, with only a minor uptick and peak in 2013. The young adult population will likely be in secular decline from now forward. US births (regardless legal status of parents) peaked in 2007 and have steadily been declining from ’07’s 4.3 million annually to 3.5 million in 2021. This continually smaller cohort will be replacing the larger previous cohorts and the young adult feeder population will likely only continue to shrink.

15 to 24 Employed
Japan…down, down, down.
US young adult total employment has been in decline for over four decades amid a multitude of shifts, including continually higher participation in ever more expensive post-secondary education.

15 to 24 Male Employment %

15 to 24 Female Employment %

Below charts are from UN World Population Prospects with best guestimates for annual births since 2018.
Japanese female childbearing population, post childbearing females, annual births. Not likely to be saved by higher immigration rates, Japan can only hope for 100% or maybe 110% participation rates (lol).

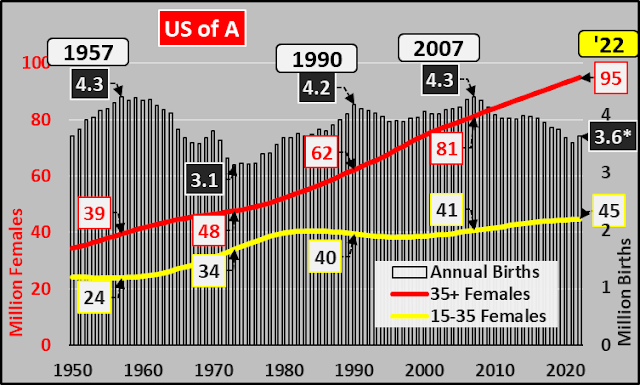
US female childbearing population, post childbearing females, annual births. Again, it should be obvious that after fifteen years of declining births…there is nothing coming but declining working age population and likely total employees.
There may be a few implications to all this…but that’s a discussion for another day. Thanks.
[ad_2]
Source link

America’s Headed for an Interest Payment Crisis
Wall Street Mood Turns Apocalyptic: Majority Sees Bear Market & Stagflation; Optimism Lowest Since Right Before Lehman