The Most Splendid Housing Bubbles in America, April Update: Raging Mania on the Eve of the Spike in Mortgage Rates
At the time rate locks were issued for those deals, mortgage rates were still around 3.2%.
By Wolf Richter for WOLF STREET.
Home prices spiked in crazy leaps – including by about 30% or more in Phoenix, Tampa, and Miami year-over-year – according to the S&P CoreLogic Case-Shiller Home Price Index today. But this raging mania took place with mortgage rates of late last year, given the long lag the Case-Shiller Index.
The long lag of the Case-Shiller Home Price Index.
The home price data released today was called “February” and represents the three-month average of closed sales that were entered into public records in December, January, February, reflecting deals that were agreed to a few weeks earlier, roughly in November, December, and January.
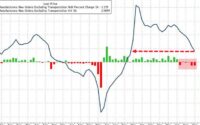
But wait… Many of these homebuyers were pre-approved and had rate locks from prior weeks and months. In November and December last year, the average 30-year fixed rate hovered at around 3.2%, according to Mortgage Bankers Association data, which is when homebuyers got the rate locks for most of these deals in today’s data (green circle in the chart):
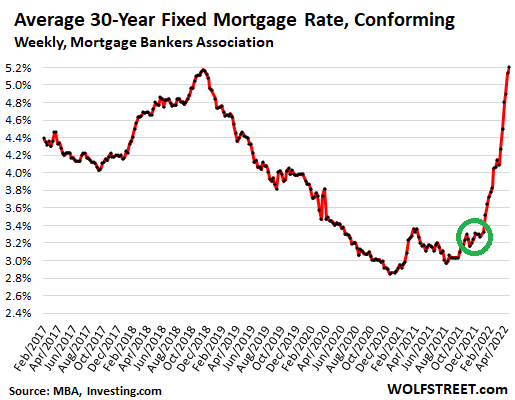
The home price data in the charts below does not yet reflect any part of the spike in mortgage rates that commenced in January. But it reflects the crazed run-up beforehand when buyers were desperately trying to buy a home with their still low rate locks.
The mad scramble at the time.
During the time reflected in today’s Case-Shiller home price data, there was a mad scramble to get the deals done before mortgage rates would rise, and this mad scramble is splendidly reflected here with some crazy spikes.
The overall National Case-Shiller Home Price Index for “February” (average of closed deals entered into public records in December, January, and February, and made in prior weeks and months) jumped 1.7% from the prior month and 19.8% year-over-year.
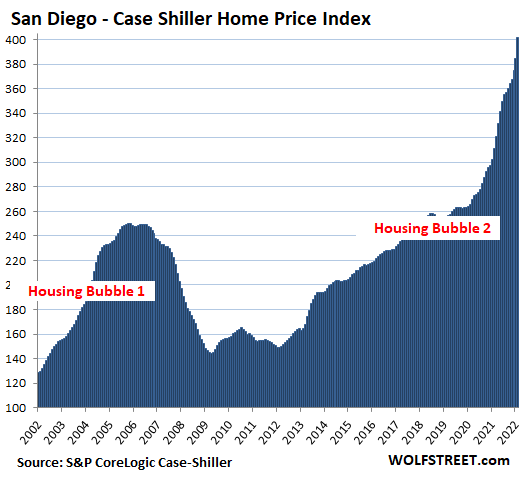
San Diego metro: Prices of single-family houses spiked by a holy-moly 4.5% in “February” from the prior month, and 29.1% year-over-year. The index value of 401 means that home prices exploded by 301% since January 2000, when the index was set at 100.
This price growth amounts to 4.3 times the rate of CPI inflation (+70%) over the same period, crowning San Diego the Number 1 most splendid housing bubble on this list:
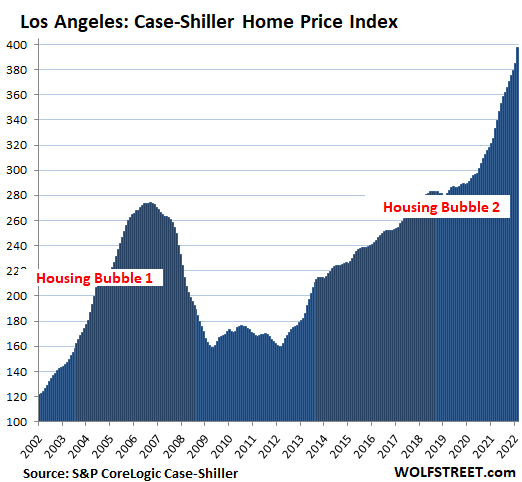
Los Angeles metro: The Case-Shiller index spiked by 3.2% in February from January and 22.1% year-over-year. With an index value of 397, house prices exploded by 297% since January 2000, crowning the Los Angeles metro as the Number 2 most splendid housing bubble on this list.
It’s just house price inflation: dollar losing purchasing power.
The Case-Shiller Index’s “sales pairs” method – comparing the price of a house when it sells in the current period to the price when it sold previously – tracks how many dollars it takes to buy the same house over time. The index includes adjustments for home improvements. By tracking the purchasing power of the dollar with regards to the same house, the index is a measure of house price inflation.
All charts here are on the same index scale, going just past 400.
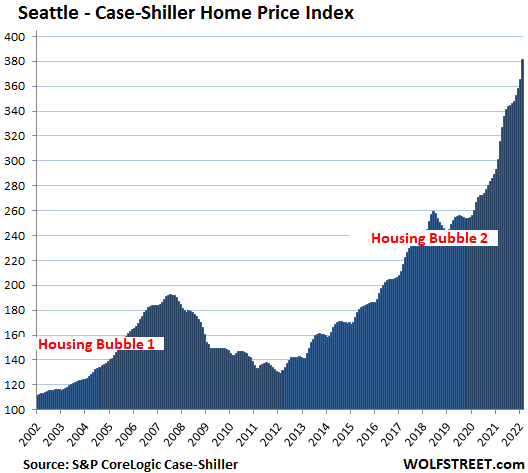
Seattle metro: House prices spiked a holy-moly 4.4% for the month, and 26.6% year-over-year. Since January 2000, house price inflation in the Seattle metro amounts to 281%, four times the rate of CPI inflation:
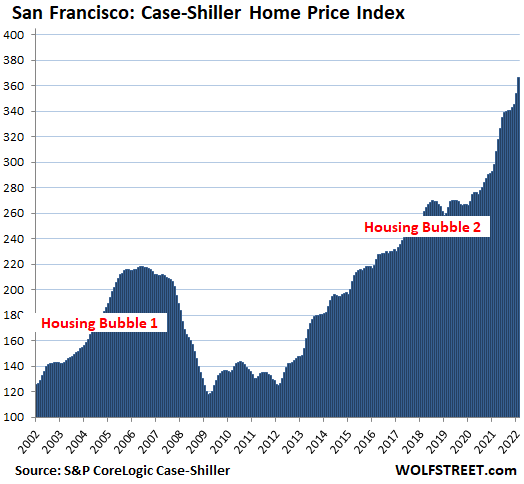
San Francisco Bay Area: Houses and condos have separated a few years ago, with condo prices lollygagging around, and house prices spiking. The Case-Shiller Index provides separate data for condos and houses for the five-county metro.
San Francisco Bay Area single-family house prices spiked 3.7% for the month, and by 22.9% year-over-year:
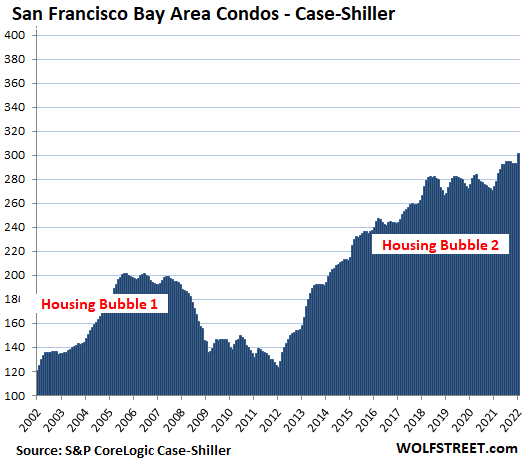
San Francisco Bay Area condo prices jumped by 2.6%, a big outlier, the little thingy sticking out on the right, after months of wobbling around and declining. The index is up 10% year-over-year. But since June 2018, condo prices have risen just 6.6%:
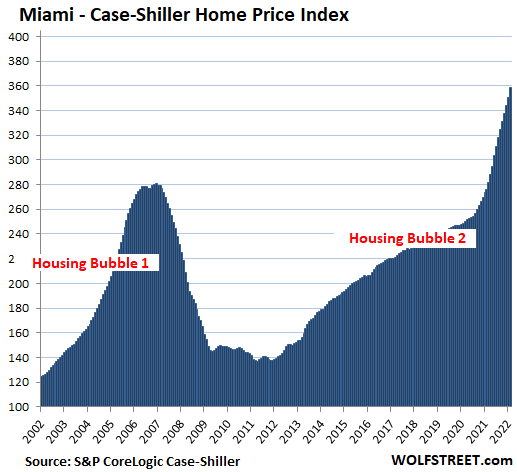
Miami metro: House prices spiked 2.3% for the month, and 29.7% year-over-year, the fastest since January 2006, on the eve of Miami’s can-never-happen-here epic Housing Bust:
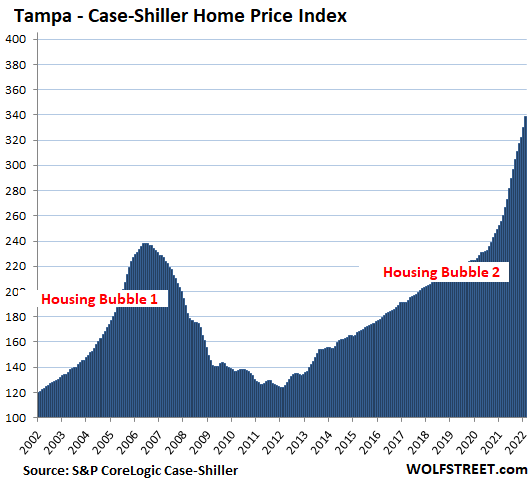
Tampa metro: House prices spiked by 2.7% for the month, and by 32.6% year-over-year, another record spike for the Tampa metro, wiping out the record spikes in the prior months, and out-spiking the crazy spikes on the eve of the housing bust:
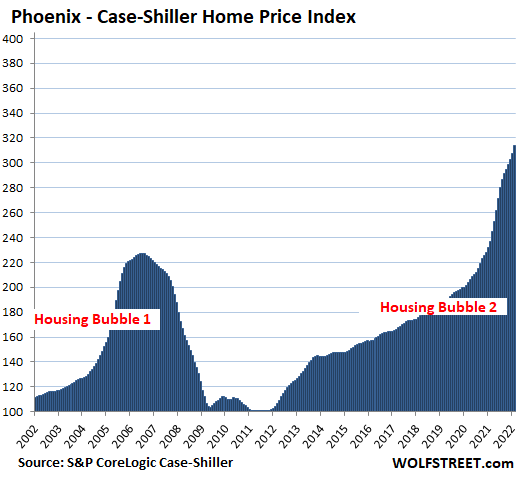
Phoenix metro: House prices spiked by 2.2% for the month, and by a record 32.9% year-over-year, the eighth month in a row of 30%+ year-over-year spikes:
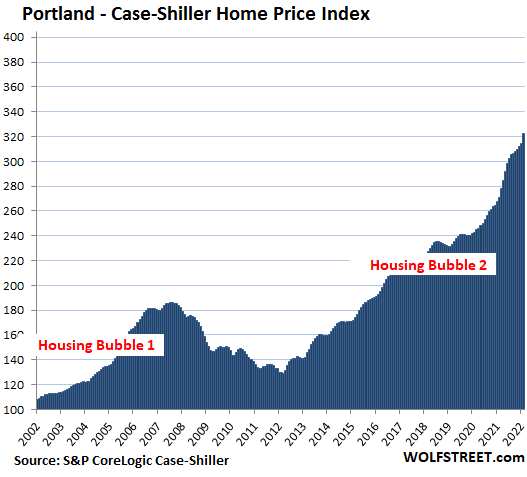
Portland metro: +2.5% for the month, and +19.0% year-over-year:
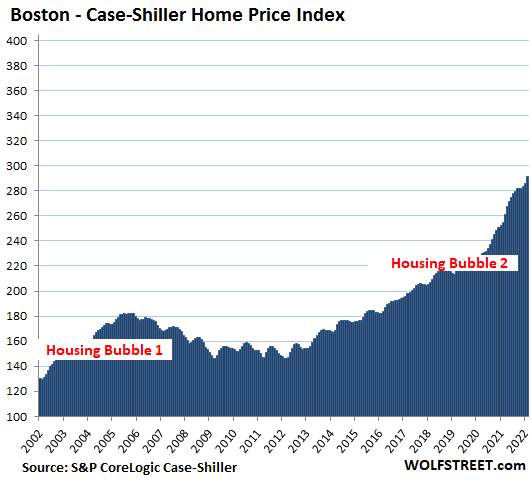
Boston metro: +2.1% for the month, and +14.6% year-over-year:
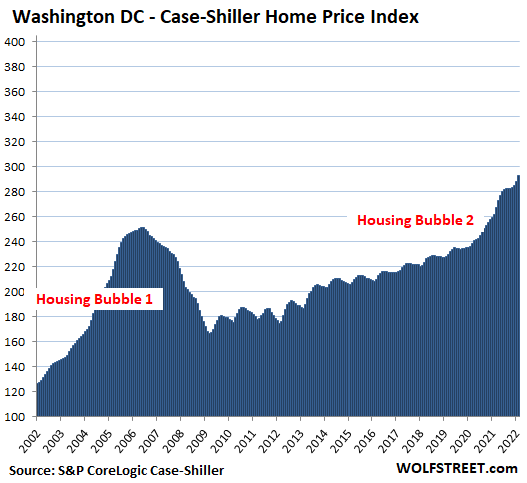
Washington D.C. metro: +1.7% for the month, and +11.9% year-over-year:
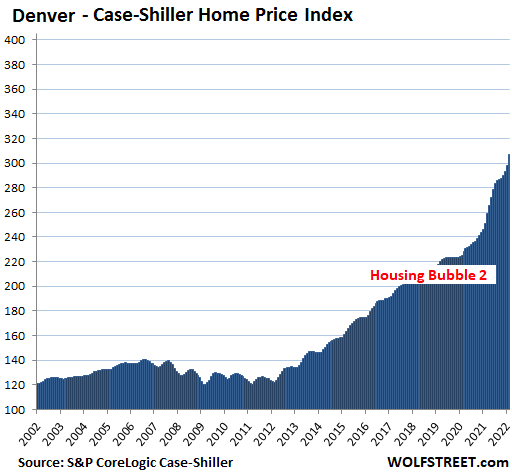
Denver metro: +3.1% for the month, and +22.3% year-over-year:
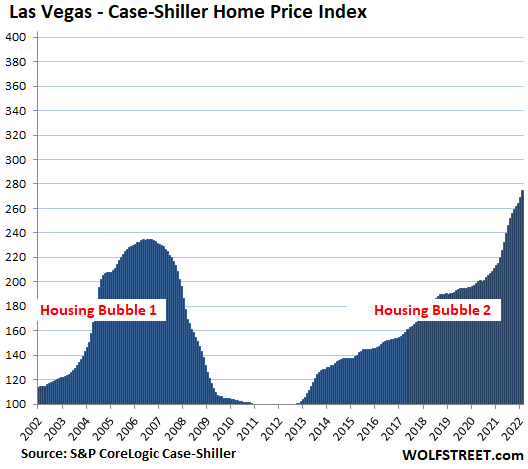
Las Vegas metro: +2.1% for the month, and +27.5% year-over-year:
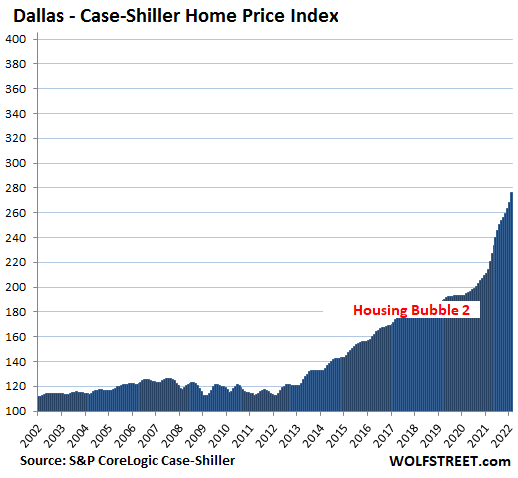
Dallas metro: +2.9% for the month, and a record +28.8% year-over-year:
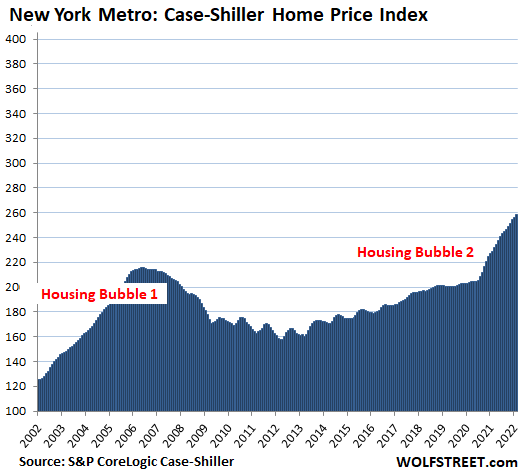
New York metro: +1.1% for the month, and +12.9% year-over-year. At an index value of 259, the metro has experienced 159% house price inflation since January 2000, compared to 70% CPI inflation.
The remaining metros in the 20-metro Case-Shiller Index – Atlanta, Charlotte, Chicago, Cleveland, Detroit, and Minneapolis – have experienced house price inflation since 2000 that doesn’t measure up to these splendid housing bubbles here, and they therefore don’t qualify yet to be included in this illustrious list.
Enjoy reading WOLF STREET and want to support it? Using ad blockers – I totally get why – but want to support the site? You can donate. I appreciate it immensely. Click on the beer and iced-tea mug to find out how:

Would you like to be notified via email when WOLF STREET publishes a new article? Sign up here.
![]()
[ad_2]
Source link

Futures Flat Ahead Of Powell Testimony
Core US Factory Orders Tumble In December As ISM Manufacturing Plunges