Visual Capitalist/Niccolo Conte/4-27-2022
 (Click to enlarge)
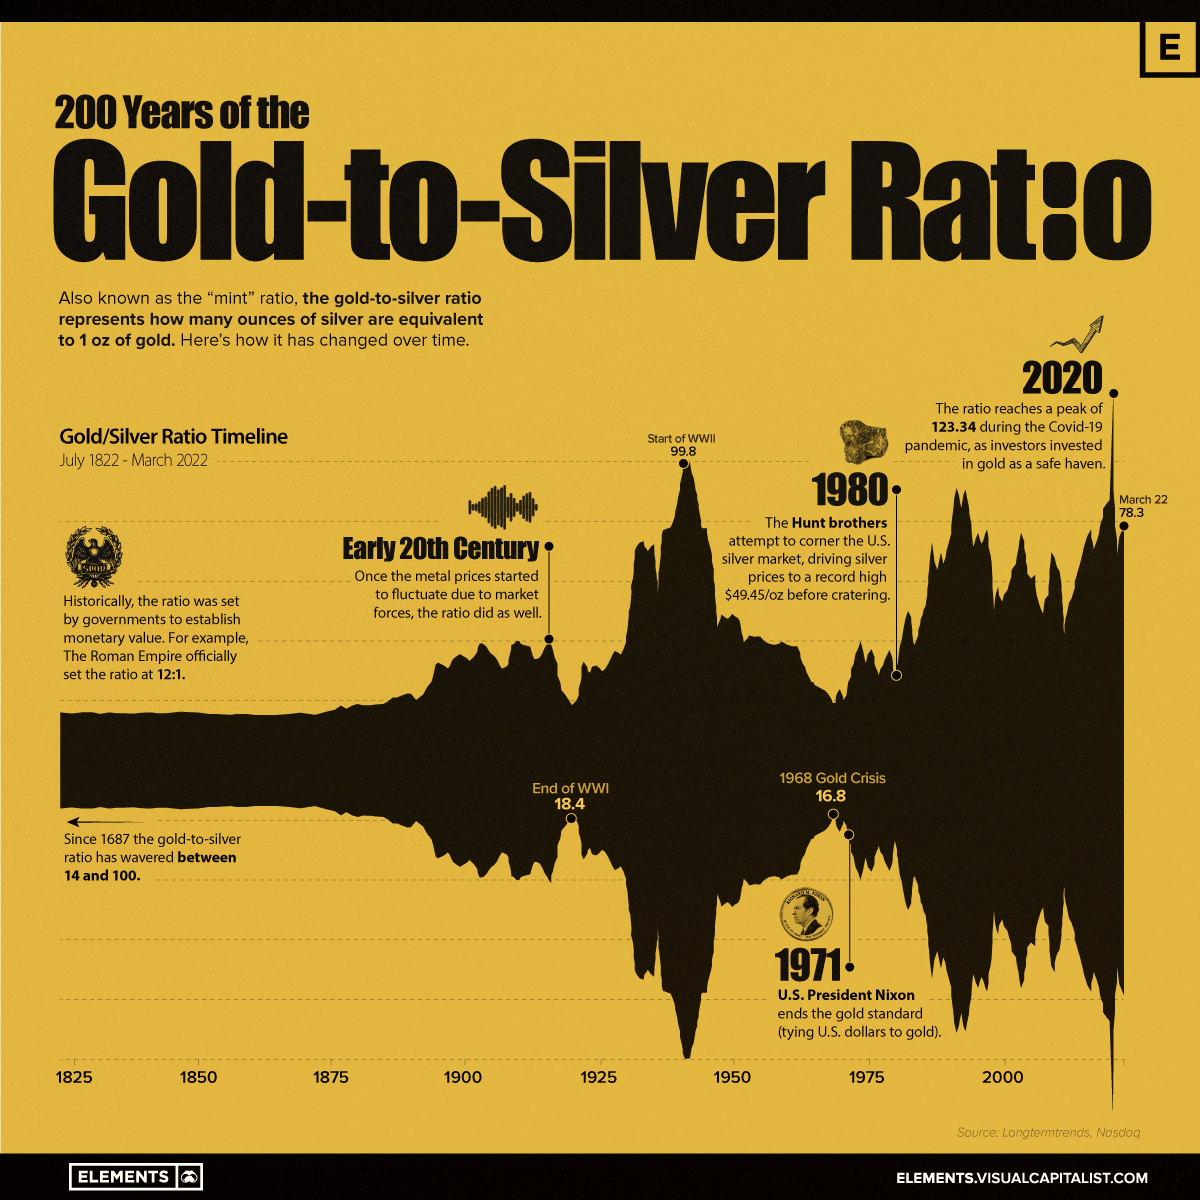
“Gold and silver have been precious and monetary metals for millennia, with the gold-to-silver ratio having been measured since the days of Ancient Rome. Historically, the ratio between gold and silver played an important role in ensuring coins had their appropriate value, and it remains an important technical metric for metals investors today. This graphic charts 200 years of the gold-to-silver ratio, plotting the pivotal historical events that have shaped its peaks and valleys.…Recently in 2020, the ratio set new highs of more than 123:1, as pandemic fears saw investors pile into gold as a safe-haven asset. While the gold-to-silver ratio has since fallen to roughly 80:1, runaway inflation and a potential recession has put gold in the spotlight again, likely bringing further volatility to this historic ratio.”