Inflation Or Recession | Seeking Alpha

Nattakorn Maneerat/iStock via Getty Images
This newsletter issue examines the Federal Reserve’s dilemma as it tries to fight inflation, while trying not to contribute to the forming of a recession.
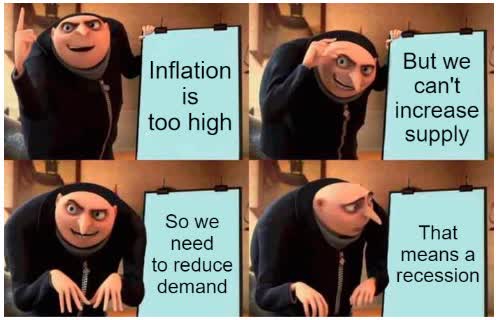
imgflip, Lyn Alden
Causes of Recent Inflation
Consumer price inflation came up fast and has been running at four-decade highs lately:
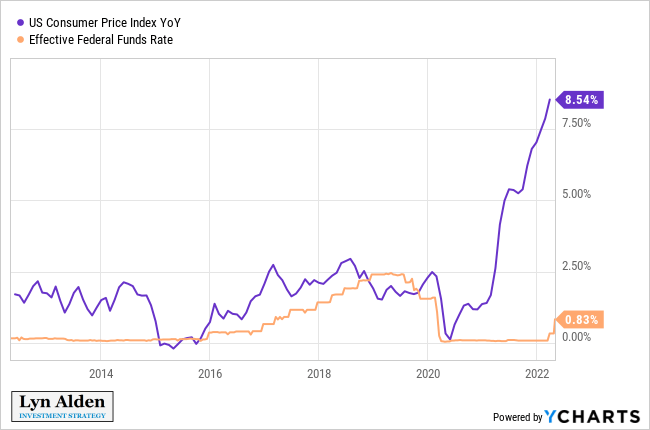
YCharts
And concerningly, by other credible ways of measuring it, the true cost of living has probably gone up even higher than that official number.
A lot of money was printed, while the supply of many goods and services was disrupted, and so prices are higher now. At the end of the day, that sentence simply summarizes it. Some big price spikes may cool off at some point as bottlenecks subside, but many prices will be at permanently higher levels now due to the substantial increase in the quantity of money.
But let’s walk back and look at this in more detail.
Back in the summer of 2019, I wrote an article highlighting the risk that we were in a bond bubble. I pointed out how low bond yields were, discussed some now-ironic contemporary magazine headlines of inflation being dead, and observed that many people were taking low inflation for granted.
Here’s the most relevant section:
Central banks around the world are nowhere near out of ammo for causing higher inflation if they want to, and many of them do have higher inflation targets than what they are currently experiencing. The U.S. Federal Reserve, Bank of Japan, and European Central Bank have all publicly expressed their disappointment in reaching inflation targets, meaning that inflation is running lower than they would prefer.
Low interest rates and quantitative easing may be near their limits of effectiveness, but central banks have other tools if they choose to use them. Central banks absolutely do not want deflation, and will not allow it. Deflation makes debts unpayable and brings an economy to a halt.
Saying that macro deflationary forces are more powerful than central bank monetary forces is like mistakenly saying Superman isn’t very strong when really he’s just holding back.
Superman holds back most of the time because he doesn’t want to accidentally kill his friends or knock down skyscrapers. He’s a nice guy. If for some reason he decides not to hold back, he can overpower basically anything, sometimes to disastrous results. There are occasional story arcs in the comics where Superman has to go all-out on a world-threatening arch-villain, like Doomsday or Darkseid.
Central banks and treasuries around the world create and control currency. They can do unusual things with it if they want to. There are all sorts of historical precedents for devaluing currency, inflating debts away, or creating fiat money out of thin air as needed.
They just have to be careful because if they push it too far, people can lose faith in a currency and it becomes worthless. If currency creators take the gloves off and want to cause inflation, they will cause inflation. The only problem would be making sure they don’t cause hyperinflation. Superman can kill an enemy if he has to, but the question is, can he do it without bringing the city down around him?
In 1933, the United States devalued the dollar by about 40% by redefining the dollar from being worth about 1/20th of an ounce of gold to only 1/35th of an ounce of gold. The government later devalued the dollar again in 1971 by taking it off the gold standard. They just changed the definition of what money is. Macro-deflationary forces are nothing against you when you have the ability to change the definition.
Currency devaluation has been standard practice for countries throughout history as their debt levels reached unsustainable levels. Currencies today are not linked to any commodities, and so currency devaluation would take the form of money-printing. Those that create currency can decide how much of it exists. They could hand it out like candy on Halloween if they want to, but they don’t do so because it would make each unit worth much less (aka inflation).
Lately, Modern Monetary Theory is the hot topic in financial media. It’s an approach that blends central bank policy with fiscal policy to print as much money as needed up to the point where inflation becomes a problem, and is what some politicians and economists advocate should be done in many developed countries.
So far, central bank tools have not been inflationary because they have primarily benefited asset prices rather than middle class consumption. They printed money, but kept the money on the central bank balance sheets by buying bonds.
If central bank actions get more aggressive, combine with fiscal policies, and start targeting the middle class, they have the power to override these various deflationary forces with sheer monetary expansion. They can issue helicopter money to pay off debts, boost inflation, build infrastructure, bail out unfunded pension systems, and prop up the middle class if that’s what policymakers decide to do.
I wouldn’t want to be holding a 20-year or 30-year bond at super-low fixed yields in that kind of environment. Negative yields would be even more vulnerable. Sometimes Superman goes all out, and every few decades, central banks do unusual things.
-Lyn Alden, July 2019
And then in early 2020, the pandemic hit, and economic lockdowns followed, including both government-mandated lockdowns and self-imposed lockdowns. The supply of goods and services was disrupted, but so was demand for many of those things, with people isolating at home. The global economy ran into a deflationary shock.
The problem is that in such a debt-based money system, with debts relative to GDP near historic highs, major deflationary shocks can’t be allowed to last long or the whole financial system will collapse. Deflation from improvements in productivity is good, but deflationary shocks in a highly-indebted system cause a vicious cycle of defaults, leading to more defaults, and more defaults, until it hits the banks and the Treasury market itself.
Additionally, so many people are unfortunately living paycheck to paycheck, and so they can’t sustain their necessities if their income is disrupted for more than a short period of time.
Or as Alfred Henry Lewis once said, “there are only nine meals between mankind and anarchy”. If people aren’t able to meet their basic needs, eventually they riot.
So indeed, an unfathomable amount of money was printed and distributed. Some of it was given to people directly in the form of stimulus checks and child tax credits. A lot of it was given to corporations and business owners, with a significant amount of fraud having occurred.
Much like how Superman stops holding back when he fights Doomsday or Darkseid, Congress and the Fed took the gloves off and collectively threw trillions of dollars at the problem, with programs that were hastily put together. And after a delay, as that vast amount of money worked its way through the system, we indeed got broad consumer price inflation. Faced with a rock (deflationary collapse) or a hard place (inflation), they chose the latter, as they basically have to do at that point.
I’ve compared this 2020s situation to the 1940s a number of times with descriptions and charts. This one was from September 2020:
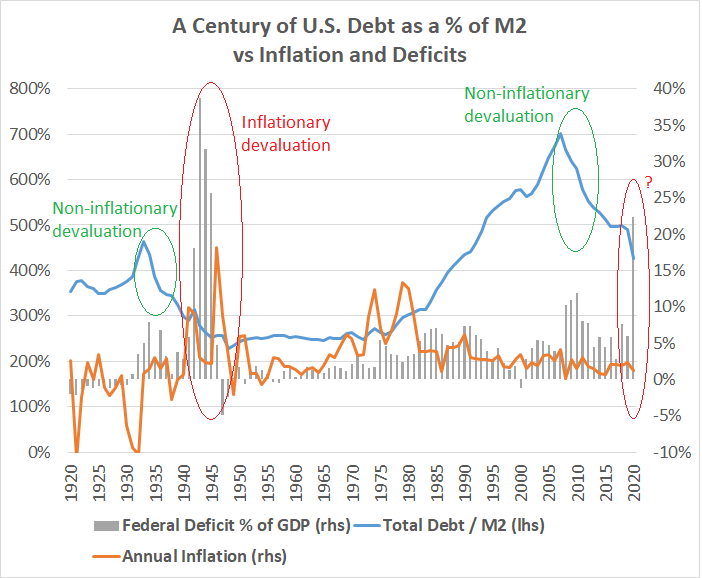
Lyn Alden
And this one was from May 2021:
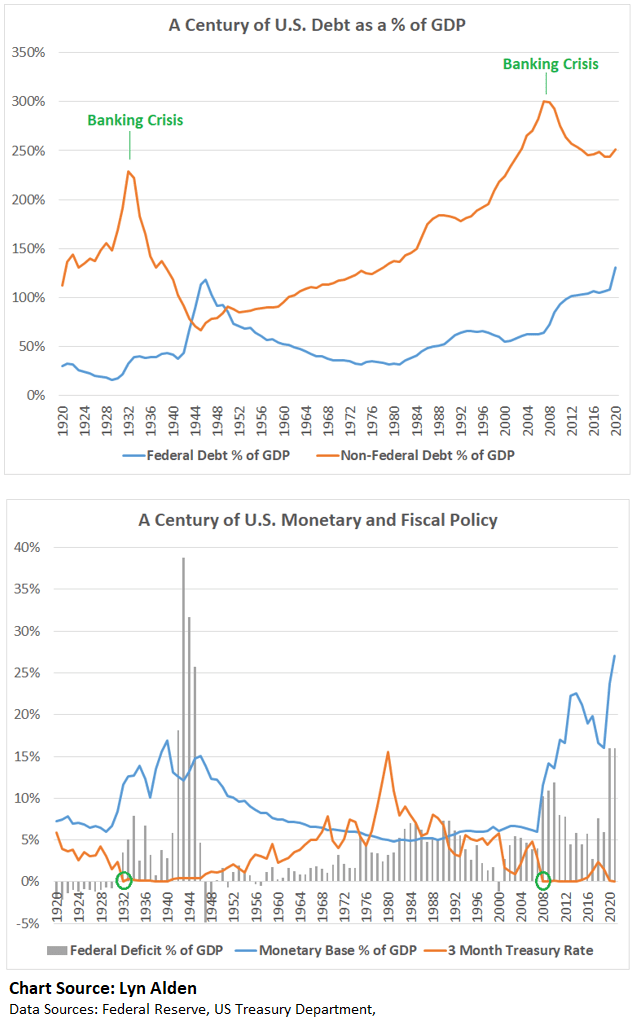
Lyn Alden
In the early stages of this playing out, I wrote a number of reports, articles, and newsletters about the rising probability of inflation, which remain relevant today. Here’s a snippet from my “QE, MMT, and Inflation/Deflation: A Primer” article:
With all of this money-printing likely to occur over the next several years, the possibility for consumer price inflation becomes a matter of money velocity and confidence in the dollar. Putting $10+ trillion in new capital into a country with $118 trillion in total starting household net worth and $14 trillion in starting money supply can be inflationary, depending on what share of that money ends up in consumer hands, how far nominal asset prices fall, how much of that money goes to deleveraging, the degree to which lending multiplies the effect of that new money, and so forth.
The biggest variable in the near-term and intermediate-term to monitor for broad consumer price inflation in my view (outside of targeted areas of supply chain disruptions) is the total amount of QE-funded money that makes it to Main Street, meaning to the public, as well as their ability to come out of quarantine and spend it. And then for the longer-run, the on-shoring of supply chains and big infrastructure projects amid a period of deglobalization, if it happens, is something to watch as it pertains to more structural inflation.
These are trends I’ll be monitoring in the quarters and years ahead. Outside of food, healthcare, and other essentials which have inflationary catalysts at the moment, the trend is likely to be disinflationary for many discretionary goods and services until a large amount of helicopter-like money ends up on Main Street in the form of more checks, negative payroll taxes, considerably extended unemployment benefits, or other stimulus policies. And the probability of those types of policies occurring over the next few years is likely higher than many people think due to how few assets the bottom 50% of the population has and how reliant they are on active income streams.
At that point, the possibility for broadly higher consumer price inflation is on the table and the four-decade period of disinflation from the 1980’s to the 2020’s will have ended.
-Lyn Alden, May 2020
Basically, I wasn’t sure how high inflation would go, or over what timeline specifically, but all of the main ingredients for broad price inflation were clearly there.
This chart shows the broad US money supply in blue, and the year-over-year percentage change in broad money supply in red:
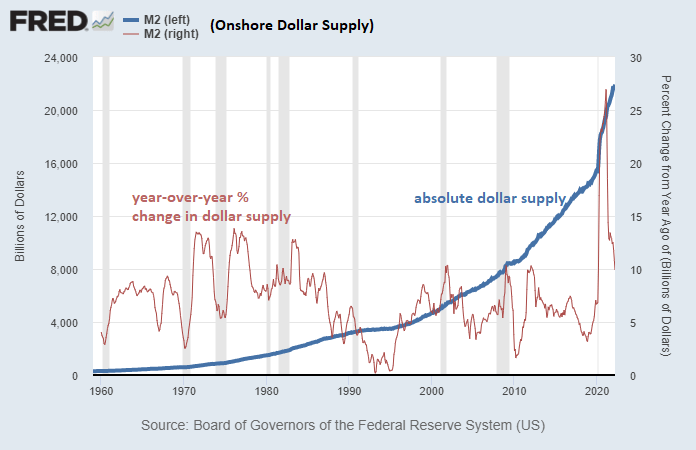
St. Louis Fed
And here’s a historical look at consumer price inflation as officially measured:
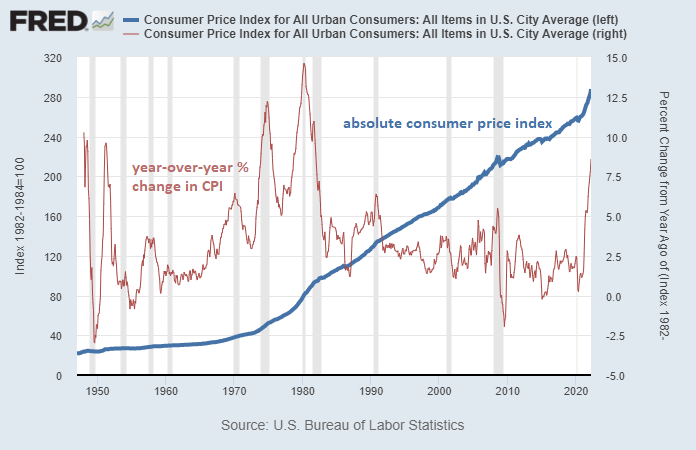
St. Louis Fed
Aside from the sharp increase in the broad supply of money, the other side of the inflation equation is the real-world supply goods and services. If we print a ton of money but the supply of goods and services is incredibly abundant, we might not get much price inflation. However, if those things have tight supply limitations, then that’s when price inflation will show up.
Supply chains have been disrupted in numerous ways, from lockdowns, to wars, to shifts in consumer demand (e.g. less business travel and more home-based work setups). Additionally, large portions of the commodity complex have been underinvested in during the past several years, and continue to be underinvested in:
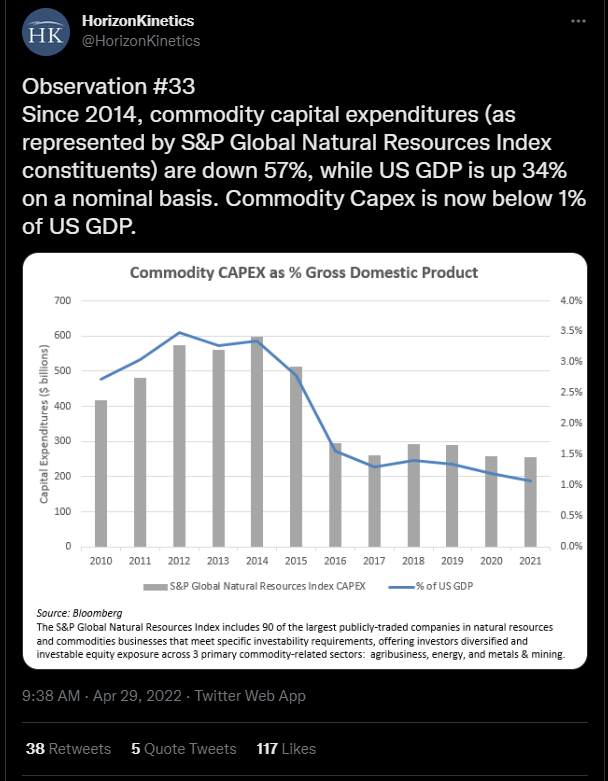
Horizon Kinetics
During the 2010s decade, the rise of (mostly unprofitable) US shale oil resulted in oversupplied conditions for the world. With low interest rates, new technology, and plenty of appetite to deploy capital into the space regardless of profitability, we had more oil than we knew what to do with for a while, and that helped keep prices low.
But those wells deplete quickly, and require continued investment into new drilling in order to maintain that level of output, let alone grow it. Eventually, due to low oil prices as well as shifts towards ESG investing, large pools of capital started investing less in the space, and began expecting management to focus on profitability and capital returns rather than unprofitable growth. We also had abundant supply of many other commodities during the 2010s decade, resulting in low prices, and thus low incentive to find and develop more mines. This type of commodity cycle happens every couple decades or so.
Commodity prices were therefore structurally deflationary for quite a while, until they ran into a shortage:
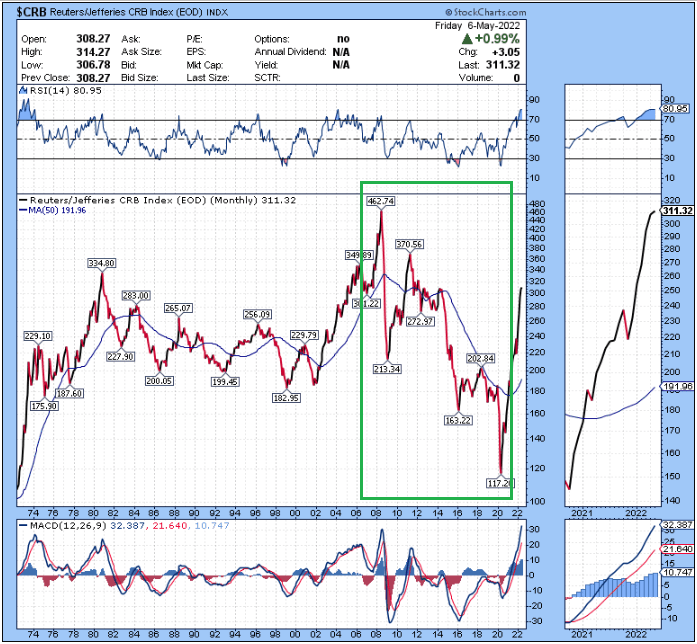
Stock Charts
Now, due to years of low investment in commodities, the world is no longer oversupplied on many of those commodities, including oil and gas and copper and nickel. Supply is tight, and falling global trust between countries makes that supply effectively even tighter, since the smooth distribution of that supply globally is in question.
Looking at oil futures four or five years out, the prices are still in the $65-$75 range, compared to $110 today. The market expects oil to come back down sharply. If you’re an oil producer, why would you significantly ramp up capex and production with oil futures priced that low? The beatings (supply constraints) will continue until morale (market pricing) improves.
Stagflation (a sluggish economy combined with high inflation) is typically the result of malinvestment or war or both.
For an extreme example, if we print a trillion dollars and use it to develop natural resources and factories, then the abundance of those new resources can offset the increase in the money supply, and thus could avoid inflation of commodities in dollar terms. We’d have both more money, and more stuff. The price ratio of the scarcest assets (prime real estate, hard monies, and so forth) to dollars and commodities, however, would probably increase.
On the other hand if we print a trillion dollars to drop bombs on productive assets, build a hundred of the world’s tallest skyscrapers and then tear them down, and put every billionaire up into space and back down a few times, to use a list of dumb examples to illustrate the point in the opposite direction, then at the end of that period we’ll have a lot more money in circulation but not more supply of resources, and so we’ll likely get broad price inflation.
The Pushback Against Inflation
Okay, so now we have broad price inflation happening for multiple reasons. The official inflation number is around 4x as high as the Fed’s 2% inflation target.
Fed officials repeatedly said this price inflation would be transitory, but then it spiked way higher and longer than they anticipated.
And price inflation is mostly a global phenomenon at this point, because commodities are a global market. If the US prints a lot of money and gives it to people, and those people buy up scarce commodities, that pushes up prices for everyone else too, including for countries that didn’t print as much money. The same is true for shipping capacity and things like that. Some types of price inflation are relatively local, like Europe’s natural gas crisis, while most types of price inflation spread around the world like a virus.
So, now comes the central bank counter attack, to try to contain price inflation that they previously underestimated.
The problem, of course, is that central banks like the Fed cannot print oil, copper, ships, ports, or manufacturing facilities. They can’t improve the supply of real-world goods and services. All they can do, is try to weaken the demand for those things. They have to try to make you and me spend a bit less, to let the supply/demand balance of things improve, and to slow down the rate of new money creation.
To do this, they can raise interest rates to increase the cost of borrowing. If mortgage rates go up a lot, for example, it leads to fewer mortgage applications and refinancings. Fewer people move, fewer people draw equity out of their house to buy things, and so forth.
Additionally, they can stop quantitative easing “QE”, and start doing quantitative tightening “QT”. During QE, the Fed creates new base money and uses it to buy bonds from various financial institutions, which then allows those financial institutions to use that liquidity to buy more bonds or to buy stocks, and tends to weaken the currency. During QT, the Fed lets bonds mature off its balance sheet (or outright sells them), and destroys base money, which means financial institutions or the foreign sector have to buy more bonds. If this is successful at pushing down the prices of stocks and real estate a bit, it’ll give us a reverse wealth effect and convince some of us to tighten our financial belts a bit.
Back in the 1970s, Paul Volcker (then-chairman of the Fed) famously spiked interest rates to double digits, well above the inflation rate, and put the US into a recession in order to stabilize the dollar. Combed with various policies to outsource labor globally to cheaper markets and thus keep wages low, the US entered a long period of rising asset prices, falling labor costs as a share of GDP, and declining inflation levels.
The problem, however, is that public and private debt as a percentage of GDP was very low back in the 1970s, and it’s very high now. The economy could take higher rates without going into a financial crisis back then. Wealth concentration was relatively low at that time, and since that time it has reached record highs.
In other words, the levers they used back then are a lot weaker now, with lower breaking points.
So, What if the Fed Keeps Tightening Policy?
As of the latest Fed meeting last week, they hiked rates by 0.50%, and announced a plan to perform up to $47.5 billion worth of QT per month, which will increase to $95 billion per month after three months.
They are raising interest rates, and starting to reduce their balance sheet. Markets have been objecting rather seriously to this, with both stocks and bonds selling off. The stock decline has thus far been mild relative to the major crashes of history, but bonds this year had their biggest sell-off in many decades.
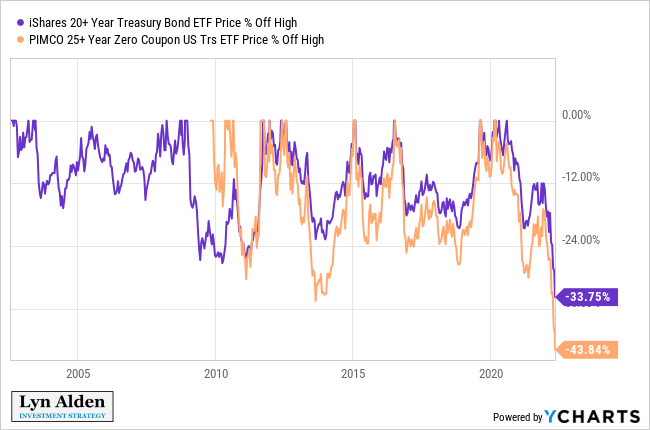
YCharts
The Fed can likely tighten for a period of time longer. However, if the Fed raises rates to 3%, 4%, 5%, and so forth when debt as a percentage of GDP is this high, the annual interest expense of the US Treasury would exceed $1 trillion, and many companies and households would run into trouble refinancing their debts. And by persistently drawing down their balance sheet with QT, it will be a negative drag on money creation and asset prices.
The dollar would likely strengthen further in that scenario, which would squeeze all of the countries that have a lot of dollar-denominated debt (which is primarily owed to places like Japan, Europe, and China). The foreign sector in aggregate would likely stop buying Treasuries, and might have to sell Treasuries to get dollars, like they did during March 2020:
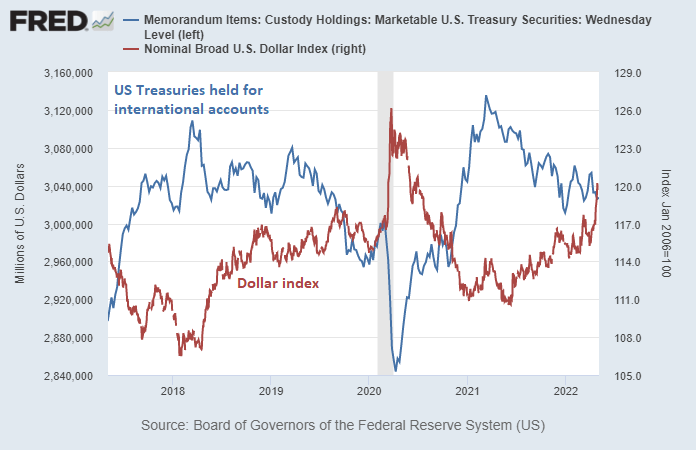
St. Louis Fed
US corporations would have unfavorable exchange rates on their exports, and export volumes would probably decrease.
The various yield curves would likely invert, the Treasury market would likely become illiquid, the high yield credit market would likely become illiquid, and recession indicators would probably worsen. Demand will have been reduced, but at the cost of a recession, and the financial system would start to seize up.
At that point, regardless of what the inflation number is, the Fed would likely have to loosen monetary policy again, and Congress may have to provide fiscal stimulus again, or face a protracted recession.
So, I think the Fed will probably get some signals to stop tightening monetary policy prior to hitting very high levels, once something in financial markets breaks. And I think that will happen before they reach 3% short-term interest rates, and/or before $1 trillion is off the balance sheet, but we’ll see.
Deteriorating Economic Conditions
When the Fed tightens monetary policy into a hot economy, asset prices typically do fine, and they are able to keep tightening policy for quite a while. Things have to get pretty tight before the economy really starts to “feel” it when they start early enough in the cycle.
However, if the Fed waits too long and tightens into a decelerating economy, that’s when things tend to get messy. And that’s what happened this time.
Consumer sentiment, for example, is already at recessionary levels:
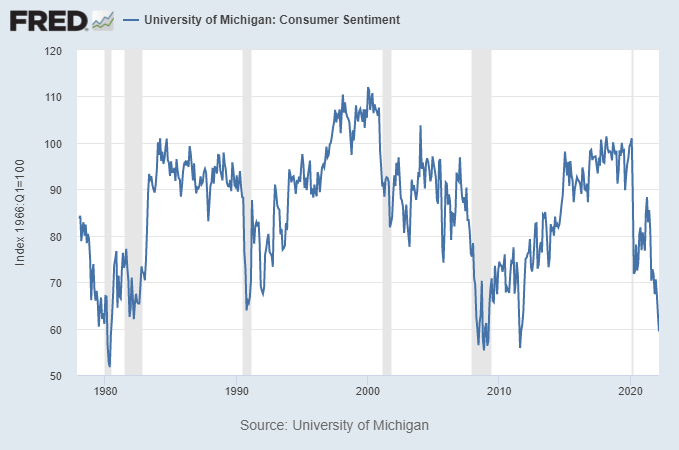
St. Louis Fed
The purchasing manager’s index is rolling over, which is a measure of broad economic acceleration/deceleration. When it goes below 50, it means it’s contracting, and usually during those troughs the Fed or Treasury are forced to do some stimulus to kickstart it again:
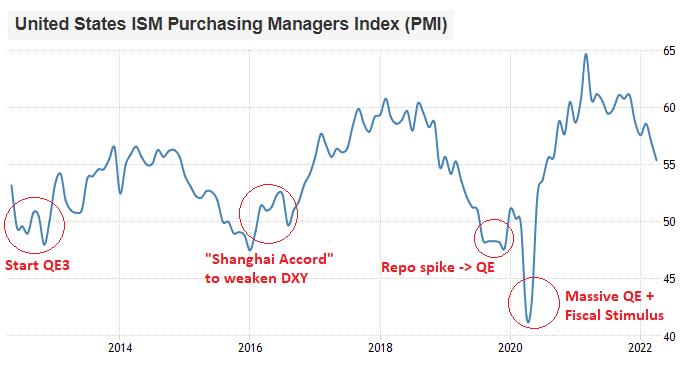
Trading Economics, annotated by Lyn Alden
The copper/gold ratio, which tracks PMI pretty closely, is also rolling over:
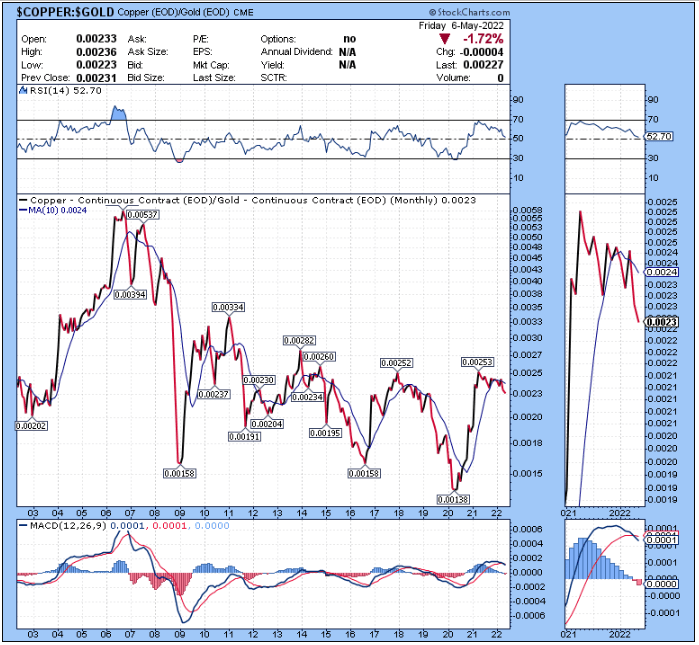
Stock Charts
Retail sales volumes are down year-over-year, which has been masked by inflationary price increases:
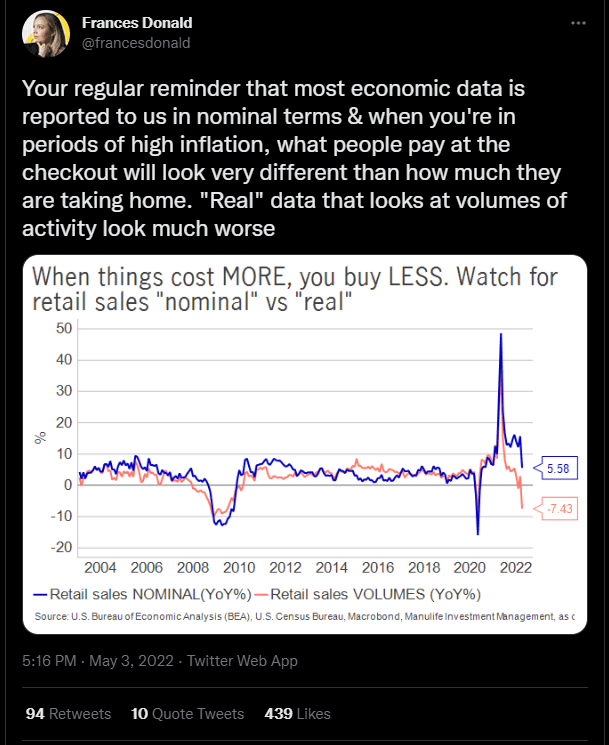
Frances Donald
Sharply rising mortgage rates have led to mortgage refinancings drying up, similar to late-2018:
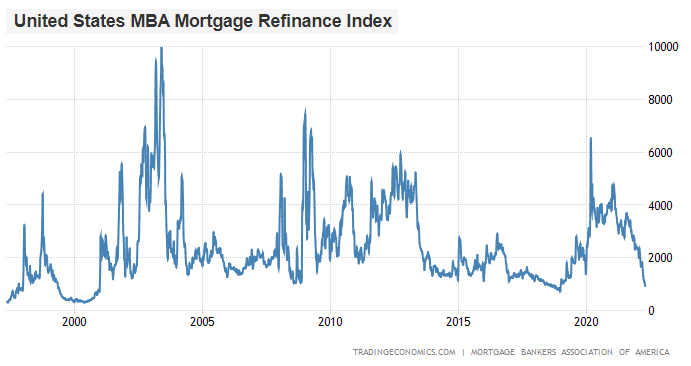
Trading Economics
The 10yr-2yr Treasury yield curve briefly inverted, and the 10yr-3mo yield curve is likely to catch down to it if the Fed keeps raising short-end interest rates:
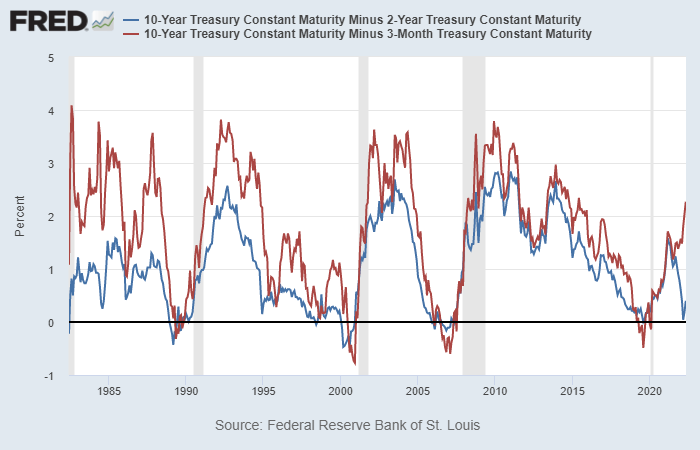
St. Louis Fed
Stock prices and real estate prices have stagnated over the past year. Bond prices had the worst sell-off in decades. Tax receipts historically follow stock prices and other asset prices, meaning that as the US economy cools off and asset prices stop going up, it’ll likely lead to a slowdown in tax revenue growth as well:
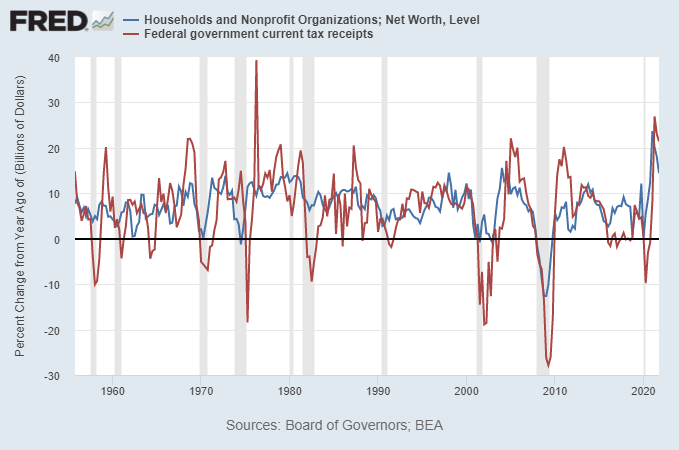
St. Louis Fed
Overall, the Fed hopes for a “soft landing”, meaning they want to thread the needle and reduce marginal demand “just enough” so that it decelerates from overheated levels but does not cause an outright recession.
While it’s technically possible, their historical record of achieving that is quite poor. They typically tighten monetary policy until a recession forms. This chart shows the Fed’s interest rate, with recessions shaded gray with red dots for clarity:
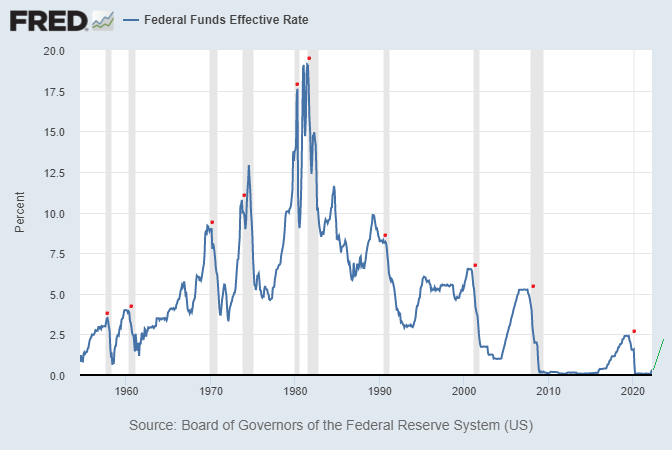
St. Louis Fed
Overall, my base case is that the Fed will tighten monetary policy until something breaks, which will force them to reverse course. It might be a recession, or it might be a near-recession slowdown.
In the prior cycle, it took a credit market freeze (late 2018, where they stopped raising rates), decelerating economic growth (mid 2019, where they did a mild interest rate cut) and a repo rate spike (late 2019, where they switched from QT to QE) for the Fed to reverse course on monetary tightening.
This time it could be credit markets again, or the Treasury market, or a couple quarters of recessionary indicators. Whatever breaks is usually not the specific thing that most people are looking for.
In each business cycle, the Fed is able to tighten monetary policy less than the previous cycle. Eventually, a stagflationary scenario, such as we are in now, is likely what will disrupt their approach. If the Fed is forced to stop tightening for any number of financial or economic reasons, while official inflation rates are still well-above their target due to supply-side shortages, then we’ll have effectively entered a new policy regime.
Final Thoughts: Think in Degrees
A lot of investors focus on binary extremes when it comes to analyzing the markets, rather than thinking in terms of degrees or probabilities.
In other words, they are often looking for a market crash or a market melt-up, rather than thinking in terms of dialing up or dialing down risk exposure and return expectations based on market conditions.
Central banks are tightening monetary policy, and thus actively trying to reduce asset prices, consumer demand, and money creation in order to tame price inflation. This tends to be a challenging environment for stocks and real estate, either in terms of downward market moves, or in terms of volatile sideways consolidations. That being said, there are times where the market can get ahead of itself, and become too bearish too quickly. And so there can be significant rallies along the way.
At least for the moment, US commercial banks are still lending. Until this rolls over, it tends to support the business cycle and nominal asset prices to some degree:
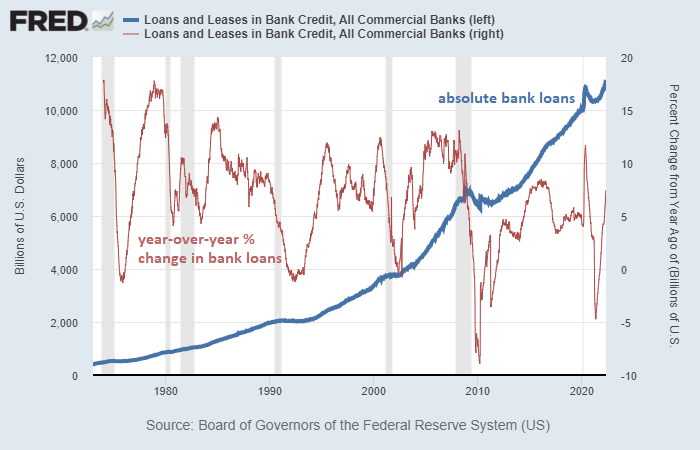
St. Louis Fed
In stagflationary environments, where growth is slowing but inflation is high, many types of asset prices tend to consolidate sideways in big volatile ranges, with sharp drops and sharp bounces along the way. They’re losing purchasing power over time, but are being denominated in a unit of account that itself is losing value, and so that’s a tricky environment to navigate.
Markets are funny in the sense that they tend to repeat the same pattern enough times to convince everyone to anticipate it, and then they change the pattern. In other words, once a pattern becomes sufficiently priced in, that’s probably not what will happen. The past few years have been historically unusual, and I suspect the next few years will be historically unusual as well, with all sorts of unique exceptions and unintuitive outcomes.
The easiest way to navigate an uncertain environment for the long run is through diversification and rebalancing. A combination of stocks, real estate, cash/bonds, commodities, and hard monies can navigate through multiple types of economic environments better than a 60/40 stock and bond portfolio, because each element of that more diversified portfolio benefits from either inflation, deflation, growth, or stagflation.
Certain hedges such as long-volatility exposures, or overweight positions in assets that you are deeply knowledgeable about, can potentially further improve your risk-adjusted returns from that diversified baseline.
[ad_2]
Source link

Citi Says US Stocks Pricing Recession More Than Any Other Asset

The Fed Is Insolvent, and That's a Bad Thing