That Q1 GDP Drop Was a Freak Event that’ll Get Unwound in Q2
In details and charts.
By Wolf Richter for WOLF STREET.
There has been a lot of confusion about that 1.4% quarter-over-quarter drop in “real” GDP. So let me just go through what didn’t cause it, and then what caused it. What caused it was a freak event, and this freak event is likely to start unwinding in Q2. We’re already seeing some evidence of it.
What didn’t cause the drop in GDP:
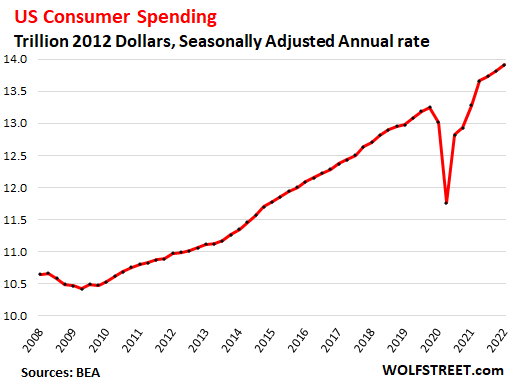
Consumer spending rose by 2.7% in Q1, annual rate, adjusted for raging inflation. It accounted for 70.5% of GDP. This growth was in the middle of the range prevalent after the Great Recession until the pandemic (from 0.4% in Q2 2011 to 4.5% in Q4 2014).
However, there has been a pronounced shift from spending on goods to spending on services, especially discretionary services, where spending had collapsed during the pandemic. These discretionary services include plane tickets, sports and entertainment venues, cruises, more or less discretionary healthcare services (such as dentists, elective surgeries, routine doctors’ visits, etc.) I discussed this shift in consumer spending from goods to services in detail here. This shift in spending from goods to services will be important in a moment. The chart shows total consumer spending in the GDP data in inflation-adjusted dollars:
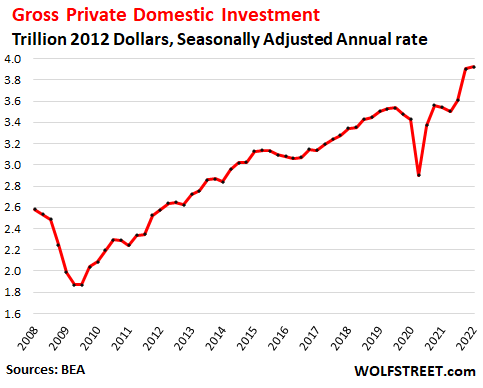
Gross private domestic investment rose by 2.3% annualized, following the spectacular spike in Q4. This measure includes investments in residential and nonresidential structures, equipment, intellectual property, etc., and it includes “change in private inventories” (more in a moment).
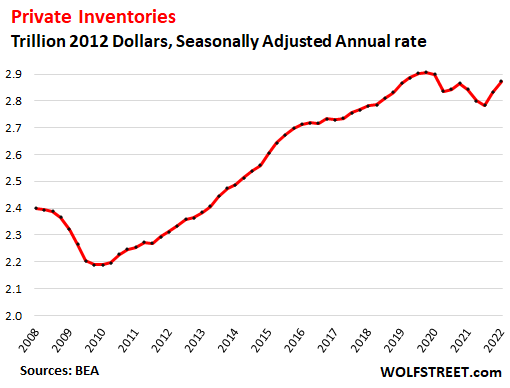
Private inventories rose by 5.7% in Q1, after the 7.1% jump in Q4, annualized and adjusted for raging inflation. There has been a boom in sales of goods, particularly durable goods in 2020 and 2021 that triggered all kinds of supply chain issues, and shortages, and US companies depleted their inventories in many goods categories. They have been scrambling to catch up, and some of the supply chain issues improved later last year and earlier this year.
In addition, consumers switched spending from goods, where spending has been dropping, to services, where spending has been surging. Goods require inventories. And the reduced demand for goods took some pressure off inventories. But inventories remain far below the levels needed for a smoothly running economy:
The Freak event that caused GDP to drop in Q1:
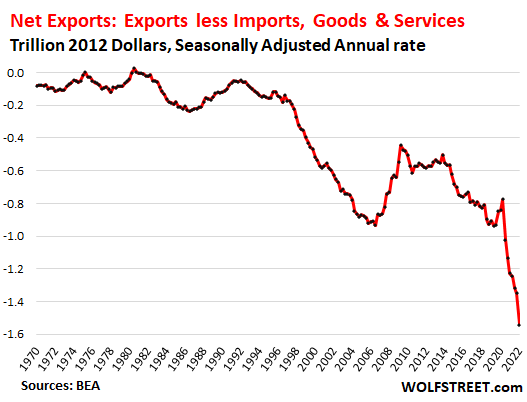
The Trade Deficit in goods & services exploded by $192 billion in Q1, annualized and adjusted for inflation, the second-worst ever drop in dollar terms, behind only Q3 2020.
Exports are added to GDP, imports are subtracted from GDP. With exports rising moderately but imports soaring, “Net Exports” (exports minus imports) have been a negative on GDP for decades. During the pandemic, stimulus-fuelled consumers spent huge record amounts on goods, many of them imported, and the trade deficit surged.
But what happened last quarter, the super-spike in the trade deficit, was extra-ordinary. As supply chains improved somewhat and as businesses were able to build inventories, imports of goods surged in a historic manner, causing the brutal worsening of the trade deficit in goods.
And this brutal worsening of the trade deficit reduced GDP by $192 billion annualized. But overall GDP fell by only $70 billion! A decline of half the size, which would have still been huge, would have produced a positive GDP reading:
Why this freak trade deficit figure will start unwinding in Q2
For the next quarter or two, the trade deficit will get smaller than the freak show in Q1, and it will be a smaller drag on GDP. Why? Because…
Consumer spending has been switching to services on a large scale, from goods (all adjusted for inflation).
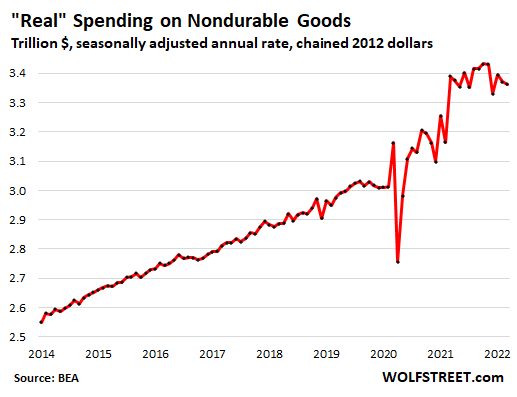
Spending on nondurable goods fell again in March, seasonally and inflation adjusted. It has been falling since November last year, and was down 0.8% from a year ago. But it still remains very high, up by 13% from 2019, and will likely ease further in Q2. Nondurable goods are mostly food, fuel, and household supplies.
Spending on durable goods has fallen sharply since March 2021 (-10.7%, adjusted for inflation). But it remained very high, up 24% from March 2019, and will likely fall further, regressing toward the pre-pandemic mean, as consumers switch their spending back to services:
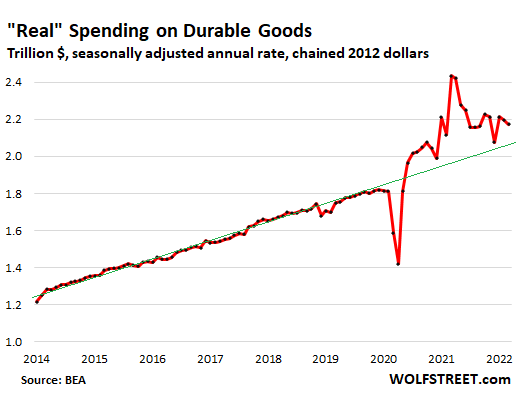
Many of these goods are imported, and a decrease in spending on goods will lower imports from the freak-show levels last year and in Q1 this year. This isn’t to say that magically, the trade deficit will disappear, but it will shift from abysmally horrible to just horrible, and the trade deficit will get smaller and be much less of a drag on GDP.
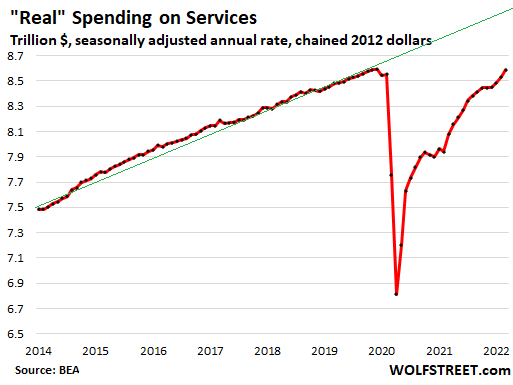
Meanwhile, spending on services is surging. Even when adjusted for inflation, it jumped by 0.6% in March, and by 6.3% year-over-year. But it remains below pre-pandemic trend and has a long way to go with higher-than-normal growth to get back to normalish levels, and we’ll see more of this normalization in Q2:
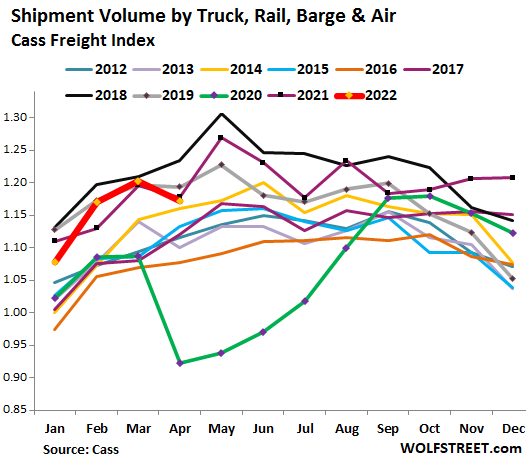
Sudden pullback in freight shows slower demand for goods in Q2.
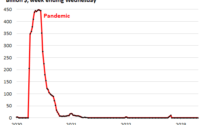
We’re already seeing US transportation volume slowing down. And this is across the board. Shipment volume in the US by all modes of transportation, but excluding commodities, fell by 0.5% year-over-year in April and by 1.8% from April 2019, and by 5.0% from April 2018, according to the Cass Freight Index (my discussion: Signs of a Downshift in the Freight Cycle, Trucking, and Demand). See the bold red line:
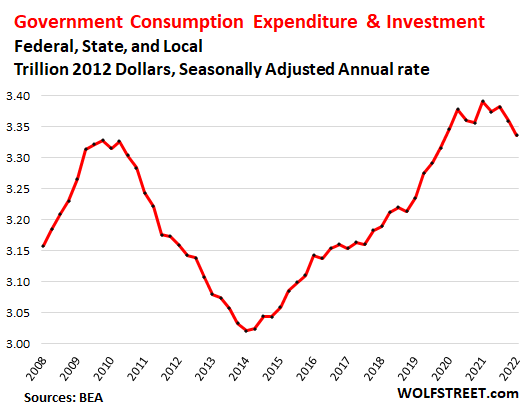
Government consumption also fell in Q1.
Spending by federal, state, local government agencies on equipment, supplies, fuel, etc. (not salaries and social spending) fell in Q1, which also dragged down GDP.
I’m not going to make predictions about government consumption, but governments at all levels are floating in a sea of cash after the money-printing binge and the high tax revenues for 2021. And these governments are going to spend this money sooner or later, which will then boost GDP.
The GDP Decline in Q1 likely gets unwound in Q2.
Less-catastrophic imports, thereby a less-catastrophic trade deficit, will reduce the drag on GDP. Consumers are holding up for now. And there is still an unspeakably huge amount of money floating around out there among consumers, businesses, and governments at the state and local levels, after the $11 trillion in stimulus in two years – $4.7 trillion from the Fed’s money-printer and about $6 trillion in government deficit spending. And some of this money will get spent over the next few quarters.
Yes, there will be a recession some day because sooner or later there always is, because recessions are part of the business cycle. But so far in the data, there is no recession being outlined. Consumer spending on durable goods has backed off from the crazy highs during the pandemic, as spending shifts to services, and overall spending growth is reverting from the spike during the pandemic to pre-pandemic normal. This normalization is happening, and that’s a good thing.
However, in terms of asset prices, there’s a rug-pull going on: The Fed has embarked on rate hikes and will soon embark on quantitative tightening, after interest-rate repression and QE have inflated nearly all asset prices to often ridiculous levels. So that’s where the action will continue to be.
Enjoy reading WOLF STREET and want to support it? Using ad blockers – I totally get why – but want to support the site? You can donate. I appreciate it immensely. Click on the beer and iced-tea mug to find out how:

Would you like to be notified via email when WOLF STREET publishes a new article? Sign up here.
![]()
[ad_2]
Source link

Talking softly without carrying a big enough hawk

US may need 7.5% unemployment to curb inflation – research