Comex Inventory: Gold Outflows Accelerate While Silver Sees Significant Shuffling

This analysis focuses on gold and silver within the Comex/CME futures exchange. See the article What is the Comex? for more detail. The charts and tables below specifically analyze the physical stock/inventory data at the Comex to show the physical movement of metal into and out of Comex vaults.
Registered = Warrant assigned and can be used for Comex delivery, Eligible = No warrant attached – owner has not made it available for delivery.
Current Trends
Gold
After restocking inventories for two months in March and April, Comex vaults have seen more than a third of the restocking removed in May and June. The movement has been primarily out of Eligible, but Registered has seen a reduction as well.
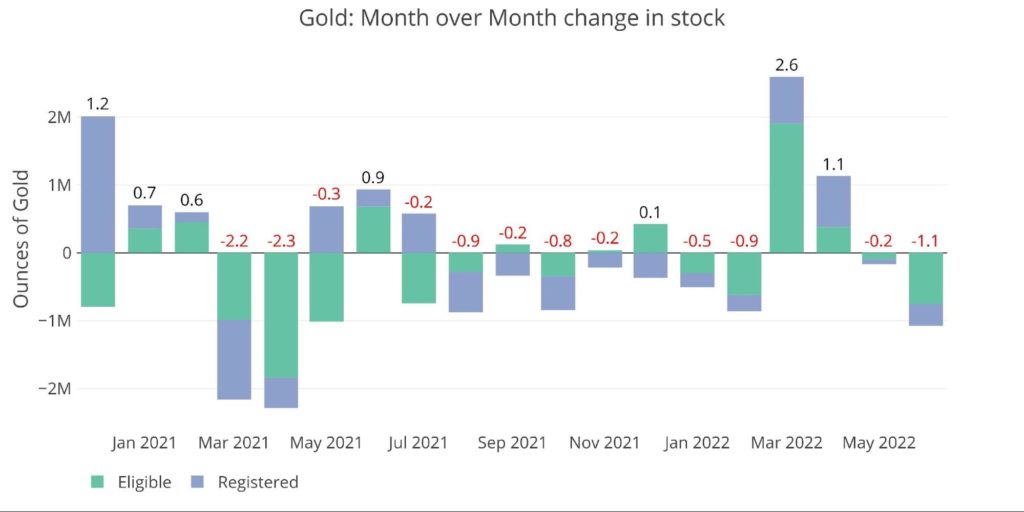
Figure: 1 Recent Monthly Stock Change
As shown below, this has been a slow steady withdraw from Eligible since mid-May, with Registered seeing a fall in the most recent days. There was a move of 165k ounces from Registered to Eligible on June 14th which was the only positive inflow into Eligible for the month.
Even with the move from Registered to Eligible, the move out of Eligible so far in June is the largest calendar monthly outflow since May of last year. June is only half over!
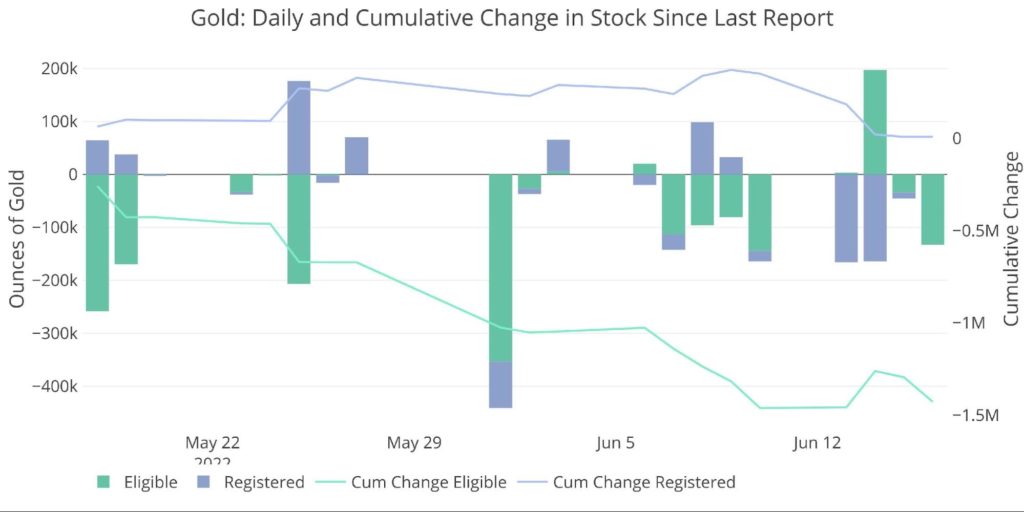
Figure: 2 Recent Monthly Stock Change
Silver
Silver saw a big move into Eligible last month (8.7M ounces). Part of it was sourced from Registered which lost 6M. June has been a bit quieter with 4.8M flowing into Eligible and 3.9M leaving Registered.
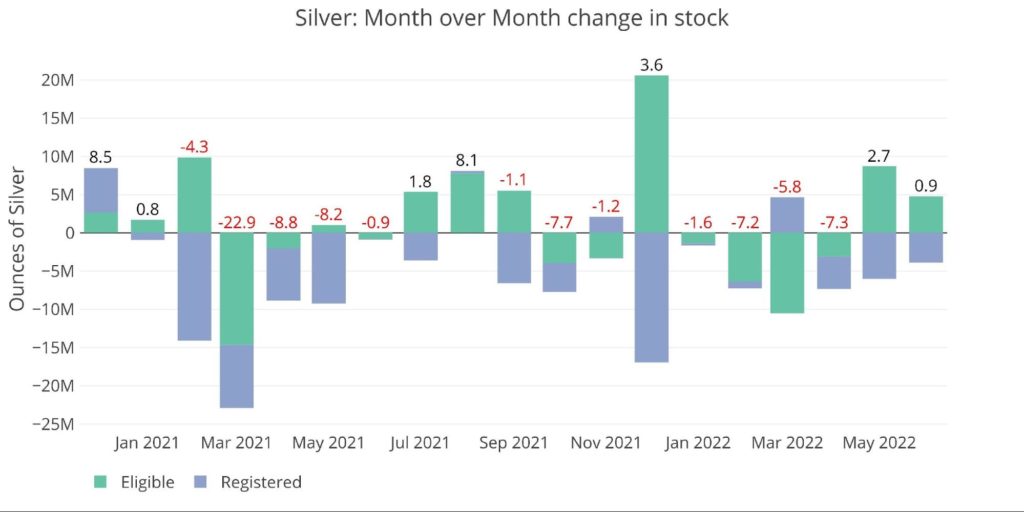
Figure: 3 Recent Monthly Stock Change
The chart below shows how and when metal moved from Registered into Eligible. Remember, Eligible is metal that is no longer made available for delivery. The owner has taken it out of circulation in the short term. The metal can be moved back in Registered at any time, but sitting in Eligible implies the owner wants to retain the metal.
The action above suggests that holders are taking delivery (which must be in Registered) and then moving it into Eligible rather than keeping it available for delivery.
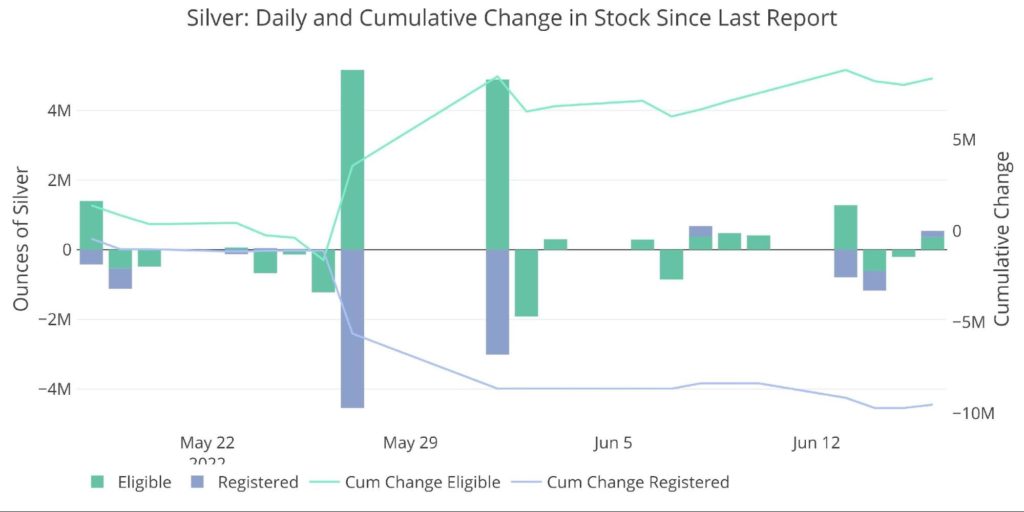
Figure: 4 Recent Monthly Stock Change
The table below summarizes the movement activity over several time periods.
Gold
- Over the last month, gold has seen a fall in Eligible of 8%
-
- This translated in a total fall in inventory of 3.7%
- Both are down in the past week leading a total drop of 1.3%
-
- Inventory is down over the past year by 1.2%
-
- Eligible is still positive over the year (2.5%)
- Registered is down by 4%
-
Silver
- Silver Registered is down by 11.7% over the last month alone
-
- Over the past year, Registered silver is down an incredible 35%
- This is metal that holders no longer want available for delivery
-
- Eligible is positive over the last month (3.2%), but this is metal not being made available for delivery
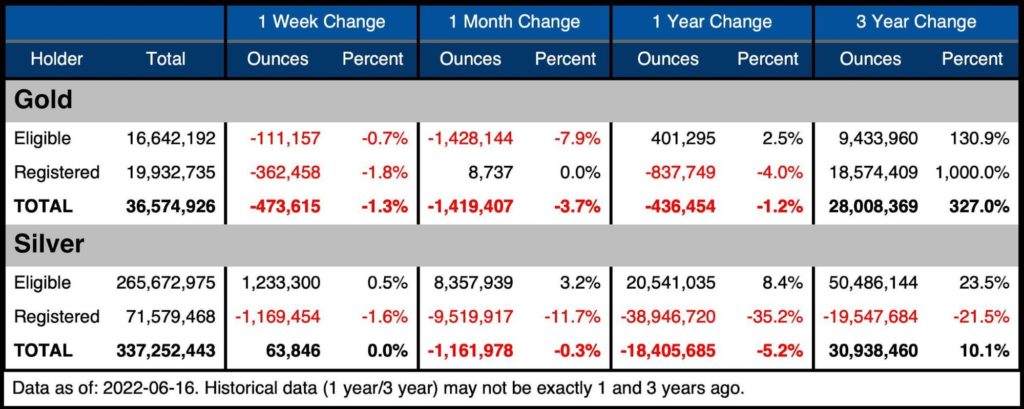
Figure: 5 Stock Change Summary
The next table shows the activity by bank/Holder. It details the numbers above to see the movement specific to vaults.
Gold
- Every vault saw outflows in the last month
- JP Morgan and HSBC both lost ~250k ounces
- Malca lost 10% of their stack, or 200k
-
- All of this came in the latest week
-
- Brinks was the big loser with 632k ounces out or 6.6%
Silver
- Silver MoM was mixed with 4 vaults adding and 4 vaults seeing outflows
- On a net basis, the move was minor at 1.1m and 0.3 out
- Within the vaults, the moves were far more pronounced
-
- Malca increased holdings by 86%
- CNT and HSBC both increased holdings by more than 10%
- Brinks saw a 5% fall (2.3m), JP Morgan dropped by 4.1% (7.2M)
- Brinks and JP have seen a significant portion of the 1-year outflows occur in the last month
-
These are very big moves in silver across vaults. It would be interesting to know what vaults are swapping metal and which ones are getting new inventory. This level of detail is not provided by the Comex.
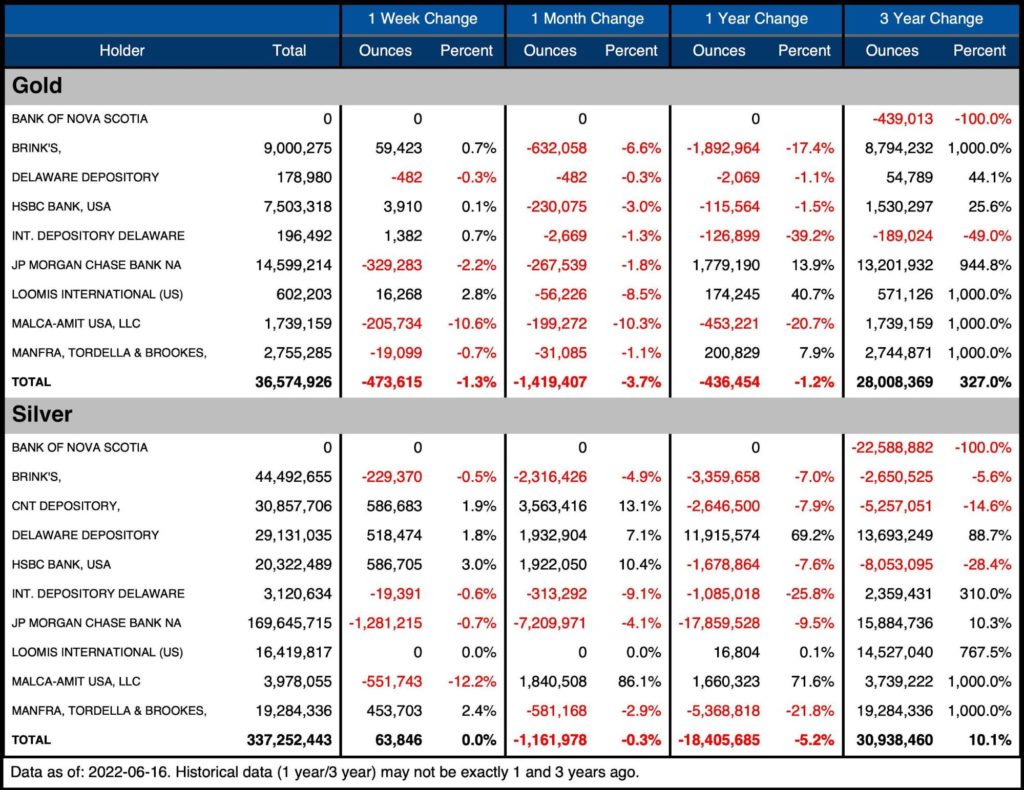
Figure: 6 Stock Change Detail
Pledged gold (a subset of Registered), continues to increase after the big jump on April 8th. Although Pledged is considered a subset of Registered, it cannot be made available for delivery without the Pledge being removed. Pledged represents gold that has been pledged as collateral. Removing Pledged from Registered in the table above would shrink the total Registered by more than 10%.
Pledged has increased quickly and dramatically since it bottomed in April. It is just below the all-time high set on Sept. 14, 2021. Brinks is the big stack in Pledged, owning about half the total. The remainder is spread across the other banks.
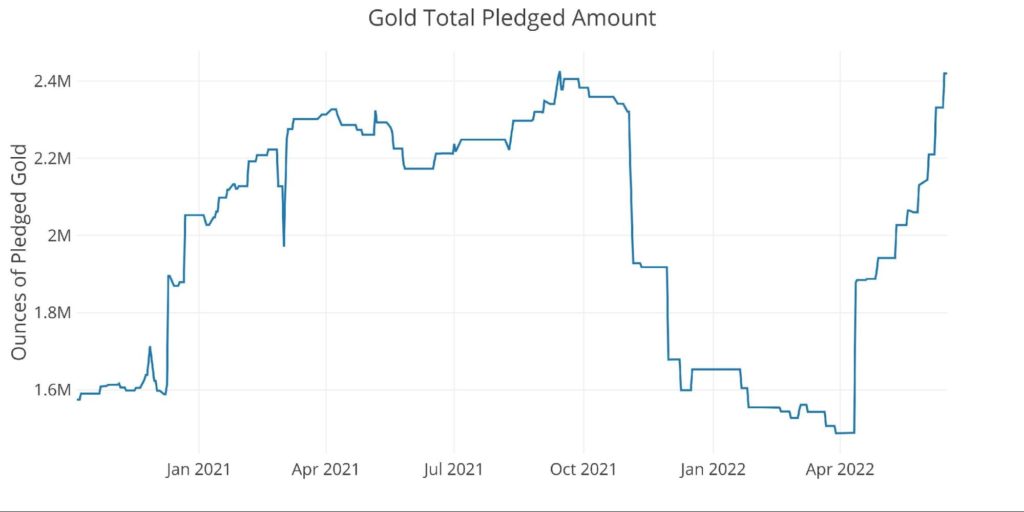
Figure: 7 Gold Pledged Holdings
Historical Perspective
Zooming out and looking at the inventory for gold and silver since 2016 shows the impact that Covid had on the Comex vaults. Gold had almost nothing in the Registered category before JP Morgan and Brinks added their London inventory with nearly 20M ounces.
The recent effort to restock is shown on the far right. This move already appears to be reversing shown by the latest dip. The market has not yet been challenged, but the surge in Registered may be tested at some point soon to see how much of that metal is really available for delivery.
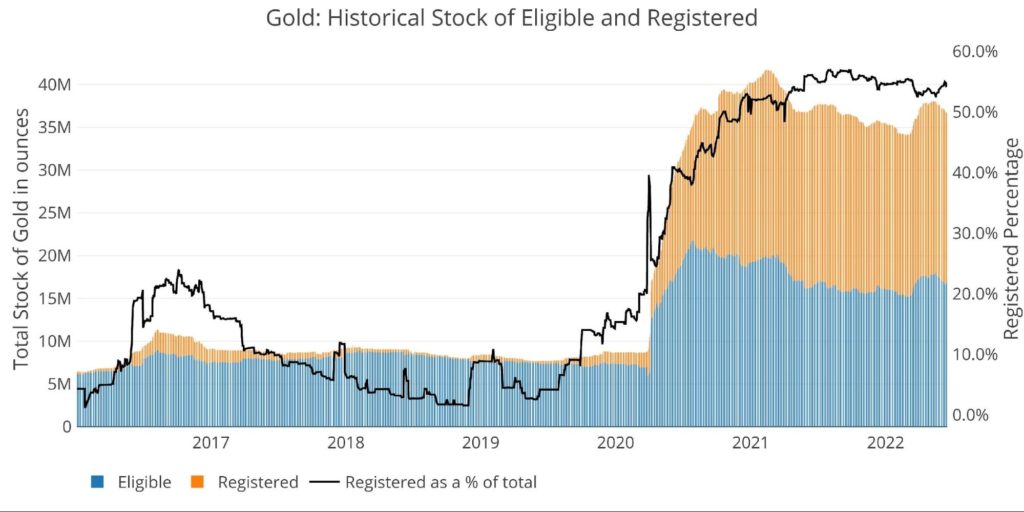
Figure: 8 Historical Eligible and Registered
Silver has seen a big move down in Registered as a % of the total. After a recent spike in March up to 27.2%, it has since fallen to 21.2%. This is the lowest ratio since February of 2018 and shows the strain that has been put on the Registered market. Although the vaults have not been cleaned out, much less silver is available for delivery.
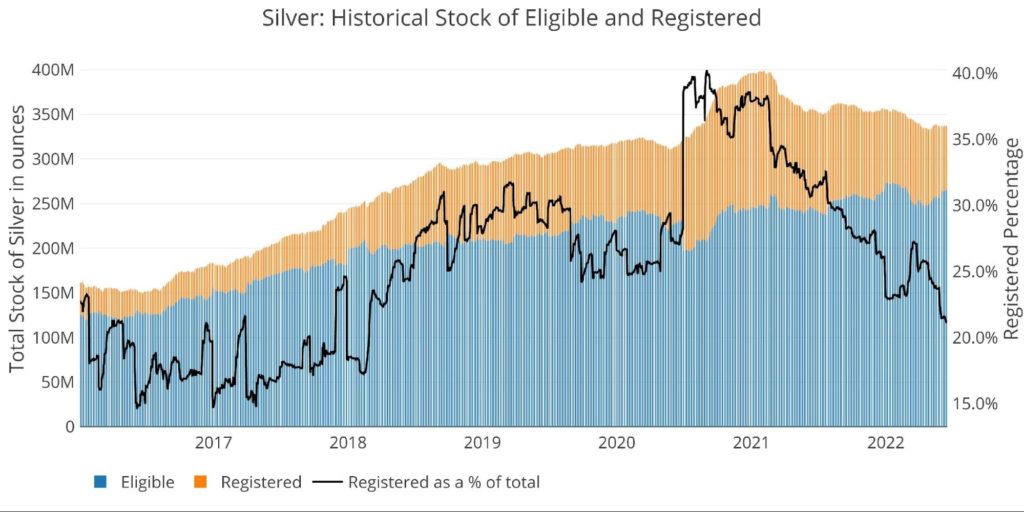
Figure: 9 Historical Eligible and Registered
Available supply for potential demand
As can be seen in the chart below, the ratio of open interest to total stock has fallen from over 8 to 1.35. In terms of Registered (available for delivery against open interest), the ratio collapsed from nose bleed levels (think Nov 2019 where 100% stood for delivery) down to 2.5 in the latest month. The move down has mostly been driven by a significant fall in open interest. Open Interest is now below 500k for the first time since December.
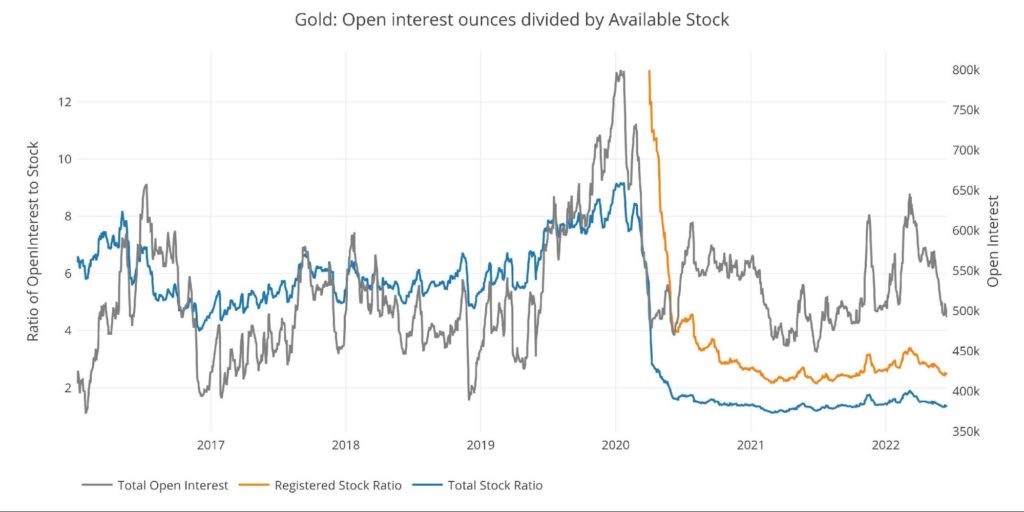
Figure: 10 Open Interest/Stock Ratio
Coverage in silver is weaker than in gold with 10.1 open interest contracts to each available physical supply of Registered (up from 8.2 at the end of April). The ratio has been driven some by a recent increase in open interest, but this is not the only driver.
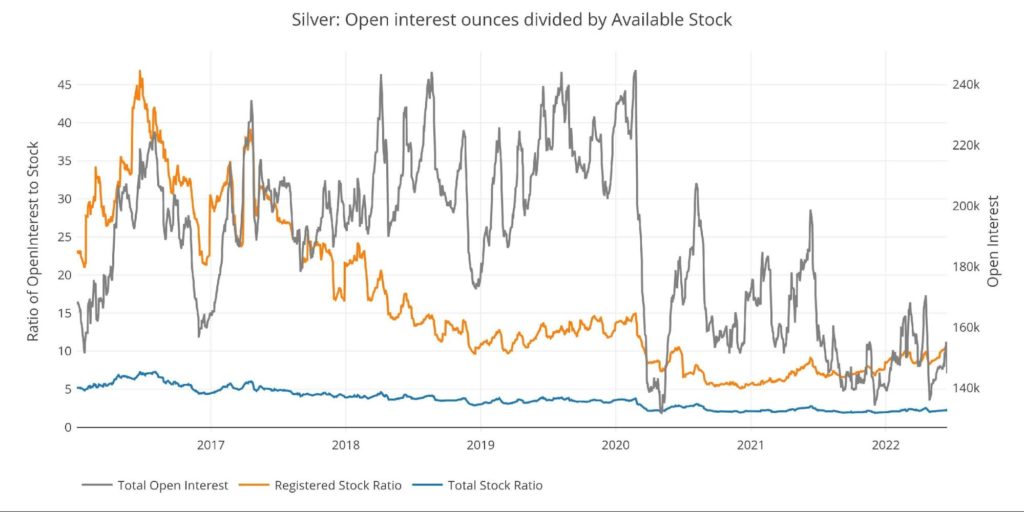
Figure: 11 Open Interest/Stock Ratio
Wrapping Up
The last month saw the price of gold oscillating tightly around $1,850. Despite the very tight trading range, much has happened. The Fed has come out more hawkish than expected, but this did not dent the gold market as much as many would think. Perhaps it’s because of the action under the surface. When physical gold is leaving vaults at the fastest pace in over a year, it helps support the overall price. While the paper market is the short-term driver of price, there is no way to overcome physical demand for metal.
The reshuffling of silver is also very noteworthy. It will be interesting to see if the game of musical chairs continues in the months ahead.
This analysis is specifically conducted to identify outlier events and trend divergences. It would be impossible to know the true reason for these divergences (Comex does not provide that detail), but the data provides hints and clues. More importantly, strong trend changes can be early signs of stress in the market. Pledged gold nearing all-time highs is another indicator that the market could be under more stress under the surface.
With the Fed on an aggressive trajectory and the economy hurtling towards stagflation, things are sure to get more volatile in the months ahead. Stay tuned!
Data Source: https://www.cmegroup.com/
Data Updated: Daily around 3 PM Eastern
Last Updated: Jun 16, 2022
Gold and Silver interactive charts and graphs can always be found on the Exploring Finance dashboard: https://exploringfinance.shinyapps.io/goldsilver/

Call 1-888-GOLD-160 and speak with a Precious Metals Specialist today!
[ad_2]
Source link
Biden’s New Budget Proposes a $4.7 Trillion Increase in Taxes

IMF Official Presents Blueprint for Cross-Border CBDCs