Let’s check in on Quantitative Tightening, How Much Progress is the Fed Making? – Mish Talk

Fed Securities Held Outright, chart by Mish
Progress looks meaningless but it has started. Let’s step back and see how we got here.
Monthly Change in Securities Held Outright

Change in Fed Securities Held Outright, chart by Mish
We had an unprecedented surge in QE which the Fed intends to roll back, starting very slowly.
Monthly Change in Securities Held Outright Detail

Change in Fed Securities Held Outright, chart by Mish
I created the above charts after seeing this Tweet.
At a weekly level, MBS looks like a bowl of spaghetti. So I used monthly averages.
Mystery?
I fail to understand the mystery. QE goosed asset prices on the way up and QT rates to do the opposite.
The Fed added liquidity and artificially lowered mortgage rates. Now it’s taking some of that back albeit very slowly.
Fed Statement
On May 4, the Fed announced its QT Schedule.
- For Treasury securities, the cap will initially be set at $30 billion per calendar month and after three months will increase to $60 billion per month. The decline in holdings of Treasury securities under this monthly cap will include Treasury coupon securities and, to the extent that coupon maturities are less than the monthly cap, Treasury bills.
- For agency debt and agency MBS, the cap will initially be set at $17.5 billion per calendar month and after three months will increase to $35 billion per month. The Desk will reinvest into agency MBS the amount of principal payments from SOMA holdings of agency debt and agency MBS received during each calendar month that exceeds the cap amount for that month.
Snails and Ants
Many people following various charts have complained the Fed is not shrinking its balance sheet.
It is. Slowly. The problem is that most treasuries mature mid-month, the rest at month-end. Week to week mortgages are extremely volatile.
I elected to watch monthly averages as a better measure of progress. QT rates to escalate soon from a snail’s pace to an ant’s pace.
Scroll to Continue
Should the Fed move faster? I believe so.
The Fed certainly had no qualms about blasting trillions of dollars lickity-split.
I would not say that QT has lifted off in a “big way” but it has happened. But we used to get by with less than a trillion dollars in reserves. I doubt we ever see that level again.
Meanwhile the free money to banks rolls in.
Hooray, More Free Money
The Fed pays interest on all reserves. At the end of May, the total reserves were $3.318 trillion.
The Federal Reserve currently pays 1.65% interest on reserves IOR.
If the Fed hikes to the range of 2.25-2.50 percent as expected, then expect IOR to jump to 2.40%.
Q: On an annual basis, how much free money are we talking about?
A: 2.40 percent of $3.318 trillion is $79.63 billion!
Q: We are giving banks $79.63 billion in free money?
A: It’s a moving target.
The IOR keeps rising but the reserve balances keep declining.
That $79.63 billion reflects a hike that has not taken place yet. If the Fed keeps hiking at a pace that exceeds QT, then the amount will rise further. If not, the actual amount of free money will drop.
For further discussion, please see Reverse Repos Hit a New Record High of $2.33 Trillion: Plus a Q&A on Free Money!
This post originated at MishTalk.Com.
Thanks for Tuning In!
Please Subscribe to MishTalk Email Alerts.
Subscribers get an email alert of each post as they happen. Read the ones you like and you can unsubscribe at any time.
If you have subscribed and do not get email alerts, please check your spam folder.
Mish
[ad_2]
Source link
Market Overview
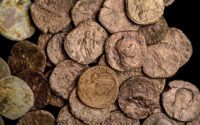
Roman Coins, Jewellery Among Shipwrecked Items Found Off Caesarea