It Gets Ugly: Inflation Shifts to Services. Food, Fuel Spike Too. Dollar’s Purchasing Power Swoons.
Oh dearie, the Fed is going to meet in late July, and it’s going to talk about services inflation.
By Wolf Richter for WOLF STREET.
Services are now starting to power this inflation. And services are where people spend the biggest part of their budget. It’s where inflation is now getting entrenched, independent of commodity prices, and where it’s very tough to bring inflation under control. The declining commodities prices may help contain food prices and gasoline prices, but not services.
Inflation in June was also driven by food and gasoline where it’s staring consumers in the face on a daily basis, though some of the price pressures are now abating. And prices of durable goods, such as cars and electronics, are rising at a less ugly pace.
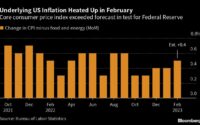
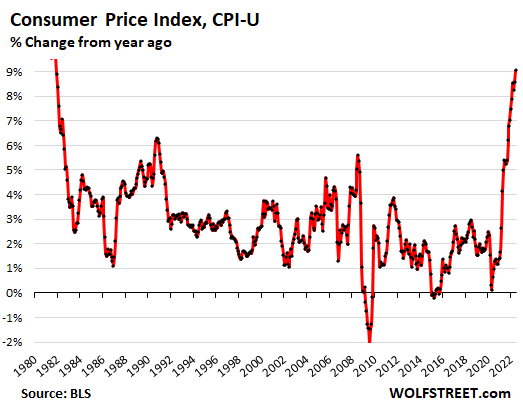
The headline Consumer Price Index (CPI-U), released today by the Bureau of Labor Statistics, spiked by 1.3% in June from May, and by 9.1% year-over-year, the worst since 1981:
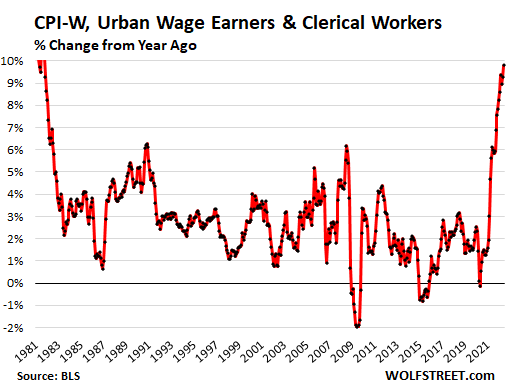
The Consumer Price Index for “all urban wage earners & clerical workers” (CPI-W), whose third-quarter average is used to adjust the COLAs for Social Security next year, spiked by 9.8% in June:
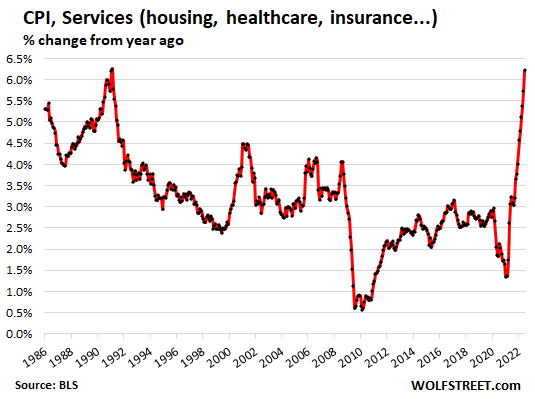
Services Inflation gets ugly and is hard to control.
Inflation in services is not related to commodities. And the recent declines in commodities that will eventually show up as lower inflation in gasoline and some food items has no impact on services.
The CPI for services spiked by 1.0% in June from May, and by 6.2% from a year ago, the worst since 1991. And this isn’t going to turn around anytime soon, and this is why the Fed is going to dish out some salty rate hikes to get this under control:
Services include housing costs, which we’ll get to in a moment, and other key items, most prominently these (year-to-year % change):
- Housing: +5.7%;
- Hotels & motels: +11.5%
- Health insurance: +17.3%
- Medical care services: +4.8%
- Airline fares, summer special: +34.1%
- Delivery services: +14.4%
- Other personal services: +6.7% (personal care: +6.3%; laundry and dry-cleaning services: +10.2%, haircuts: 6.3%)
- Video and audio services: +4.9%
- Pet services, including veterinary: +7.9%
Some services prices declined, year-over-year:
- Telephone services: -0.1%
- Car and truck rental: -7.7%
- Admission to sporting events: -6.1%
Food, oh dearie…
For people in the lower part of the income spectrum spend most of their money on necessities, and a relatively big portion of their income goes to food, and they’re getting crushed by this food inflation.
The CPI for “food at home” – food bought in stores and at markets – spiked by 1.0% in June from May, and by 12.2% year-over-year, the ugliest spike since 1979:
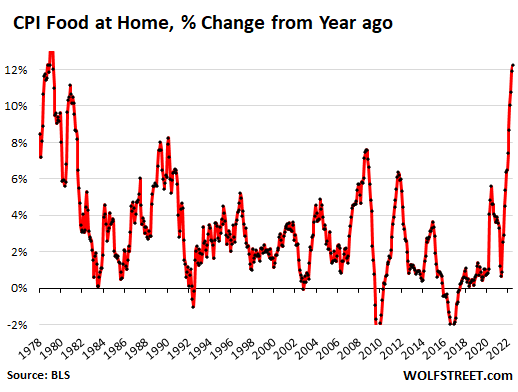
In some categories, the price spikes earlier this year are running into resistance, and prices dipped on a month-to-month basis, such as beef and pork. But prices in other categories are now going haywire, such as cereals, poultry and eggs, as inflation jumps from product category to product category.
Major food-at-home categories, and % change from a year ago:
- Cereals and cereal products: +15.1%
- Beef and veal: +4.1%
- Pork: +9.0%
- Poultry: +17.3%
- Fish and seafood: +11.0%
- Eggs: +33.1%
- Dairy and related products: +13.5%
- Fresh fruits: +7.3%
- Fresh vegetables: +6.5%
- Juices and nonalcoholic drinks: +11.6%
- Coffee: 15.8%
- Fats and oils: 19.5%
- Baby food: 14.0%
“Food away from home” CPI – such as food from restaurants, vending machines, cafeterias, and sandwich shops – jumped by 0.9% In June from May, and by 7.7% year-over-year, the most since November 1981.
Energy…
The Energy CPI spiked by 7.5% in June from May and by 41.6% from a year ago. This was driven by:
- Gasoline: +11.2% for the month, +59.9% year-over-year.
- Utility natural gas to the home: +8.2% for the month, +38.4% year-over-year.
- Electricity service: +1.7% for the month, +13.7% year-over-year.
Housing costs – they’re spiking with a lag.
The CPI for “rent of shelter” accounts for 31.9% of total CPI and is the largest component. It attempts to measure housing costs as a service (not as an asset to be purchased). It comes in two components:
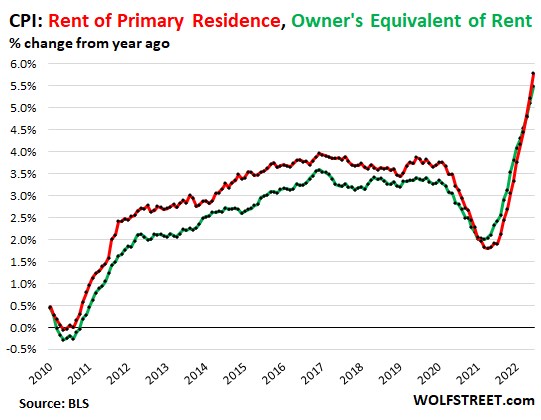
“Rent of primary residence” (accounts for 7.2% of total CPI) jumped by 0.8% in June from May, and by 5.8% year-over-year (red in the chart below). It tracks what a large panel of tenants reported about their actual rent payments over time, including in rent-controlled apartments.
“Owner’s equivalent rent of residences” (accounts for 23.7% of total CPI) jumped by 0.7% for the month and by 5.5% year-over-year (green line). It tracks the costs of homeownership as a service, based on what a large panel of homeowners report their home would rent for.
Both measures, though spiking, are still below the overall CPI and therefor are still holding down CPI, but they’re holding it down less each month, and in a few months, they will become the primary driver of CPI inflation:
CPI for housing costs, Asking Rents, and Home Prices.
The CPI for housing costs consists of two above rent measures: the first tracks rents as experienced by tenants that have been renting these homes for a while; the second tracks what homeowner think their own homes would rent for.
“Asking rents” track advertised rents of apartments and houses listed for rent. They’re a measure of rents that landlords are trying to get on their vacant units. They do not reflect actual rents paid by tenants. But they show where landlords think the current market is.
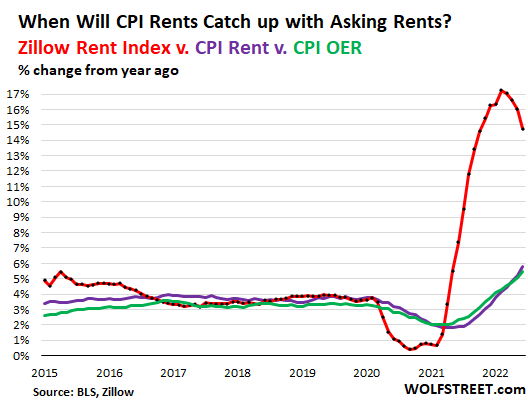
The Zillow Rent Index reflects asking rents. It jumped by 0.8% in June from May, to a record of $2,007, but that jump was smaller than the prior spikes. On a year-over-year basis, it spiked by 14.8%, which is a huge and gigantic spike, but it was smaller than the prior spikes.
But it takes a while for asking rents to become actual rents that tenants have to start paying when their lease expires and that they are then reporting as part of the CPI panel.
The “rent of primary residence” (purple) and the “owner’s equivalent rent” (green) are slowly catching up with the Zillow Rent Index (red), and they will continue to rise well into 2023 even if asking rents tracked by Zillow rise less (my discussion of this phenomenon):
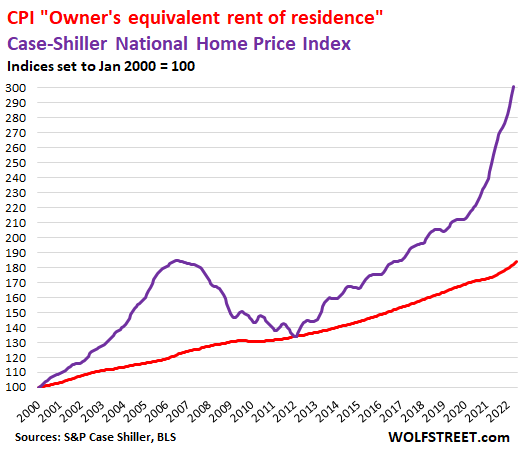
Home prices spiked by 20.4% year-over-year, according to the latest Case-Shiller Home Price Index (purple line below). I have been documenting this raging mania with my series, The Most Splendid Housing Bubbles in America.
But the CPI attempts to measure the cost of the service that a home provides – shelter – via its “owner’s equivalent or rent” (red). Both indices here are set to 100 for January 2000:
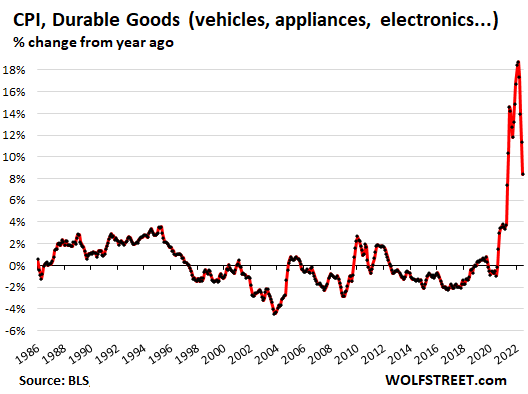
Durable goods CPI.
New vehicles, used vehicles, consumer electronics, furniture, appliances, etc. Month-to-month, CPI for durable goods rose 0.7% in June, after having ticked up just 0.1% in May and April, and having dipped in March.
Year-over-year, durable goods still spiked by 8.4%, but this was way down from the 18.7% spike in February:
Some major categories of durable goods:
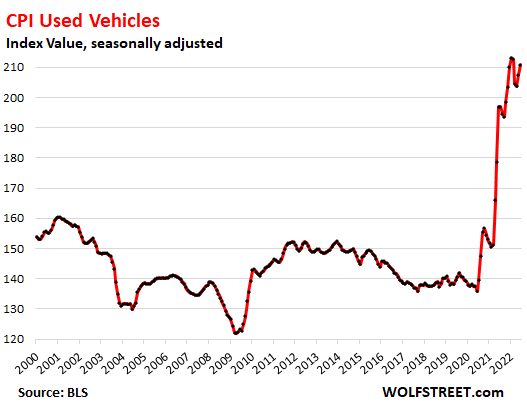
Used vehicles CPI: +1.6% in June from May, +7.1% compared to the sky-high spike a year ago exceeding 40% at one point. In February, March, and April, prices had dropped. But in May and June, prices jumped again.
This chart shows the index value (not the year-over-year % change of the index value):
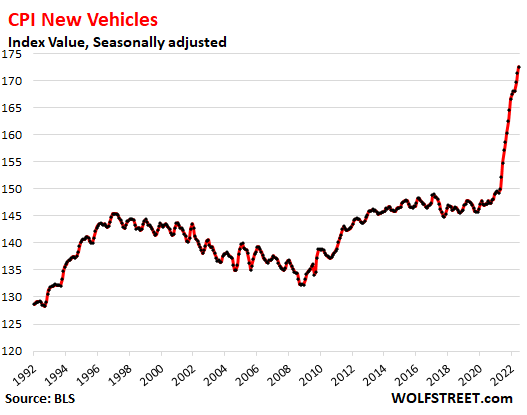
The new vehicle CPI: + 0.7% in June from May, +11.4% year-over-year. The last few months have seen the worst price spikes in the data going back to the 1950s, amid still widespread new-vehicle shortages and “above-sticker” prices. Much higher interest rates would help bring demand down, which would relieve some of the price pressures.
This chart shows the index value (not the year-over-year % change of the index value):
Information technology (computers, software, accessories, smartphones, etc.): +0.3% in June from May, -6.7% year-over-year. These types of products have gotten immeasurably more powerful over the years. Today’s smartphone runs circles around super computers in 1980 that cost millions of dollars back then. So the amount of money that you pay for what you get – which is what inflation measures – tends to fall year after year.
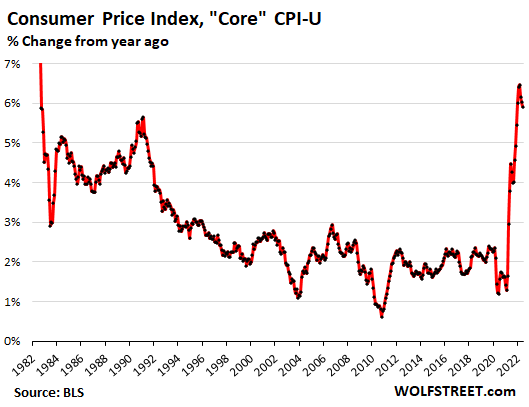
“Core” CPI.
The “core” CPI, which excludes the volatile commodities-dependent food and energy components, tracks inflation in the broader economy. It jumped by 0.7% in May from June, the biggest jump since February – accelerating again, now driven by services!
Year-over-year, it rose 5.9% from the red-hot levels a year ago. The sharper month-to-month increases and the spike in services will start to push the core CPI higher later this year.
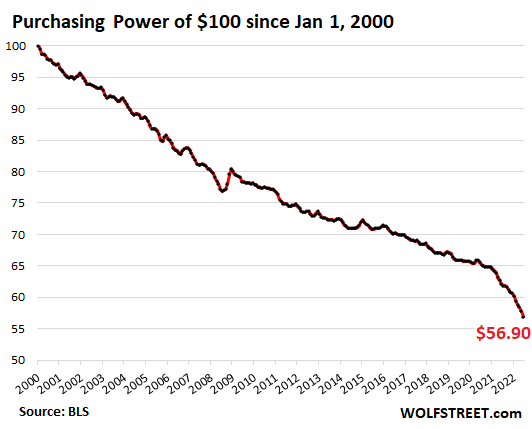
Purchasing Power of the dollar goes WHOOSH.
The CPI tracks the loss of the purchasing power of the consumer’s dollar and the purchasing power of labor. In June, the purchasing power of $100 in January 2000 dropped to $56.90 in June 2022. No wonder Americans are in a rotten mood:
And here is Fed Chair Jerome Powell contemplating the next rate hikes, as captured by cartoonist Marco Ricolli for WOLF STREET:
Enjoy reading WOLF STREET and want to support it? Using ad blockers – I totally get why – but want to support the site? You can donate. I appreciate it immensely. Click on the beer and iced-tea mug to find out how:

Would you like to be notified via email when WOLF STREET publishes a new article? Sign up here.
![]()
[ad_2]
Source link

XAU/USD may have bottomed out at the beginning of the week – Commerzbank

Recession Calls Grow, Mnuchin on Inflation Threat: Qatar Update