Housing Bubble Woes: Sales of Homes Below $500K Plunge, Total Sales Drop to Lowest since Lockdown, Supply Jumps
The magic of ridiculously inflated home prices meeting holy-moly mortgage rates.
By Wolf Richter for WOLF STREET.
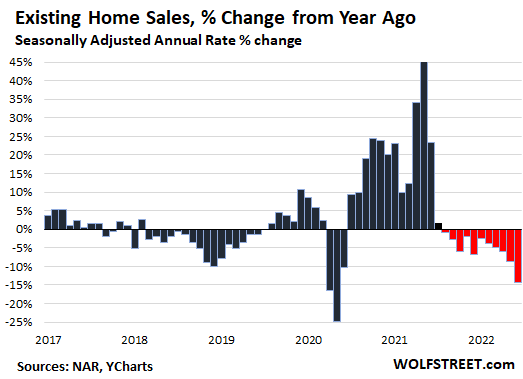
Sales of previously-owned homes of all types – single-family houses, condos, co-ops, and townhouses – dropped by 5.4% in June from May, the fifth month in a row of month-to-month declines, based on the seasonally adjusted annual rate of sales. And sales dropped by 14.2% from a year ago, the 11th month in a row of year-over-year declines.
The sales declines have been accelerating, even as all kinds of inventory is suddenly coming out of the woodwork. And the excuse for the drop in sales that there is a shortage of homes on the market has vanished.
Sales of single-family houses dropped by 12.8% year-over-year, and sales of condos and co-ops plunged by 24.7%, according to the National Association of Realtors today (historic data via YCharts):
“Both mortgage rates and home prices have risen too sharply in a short span of time,” said the NAR in its report today.
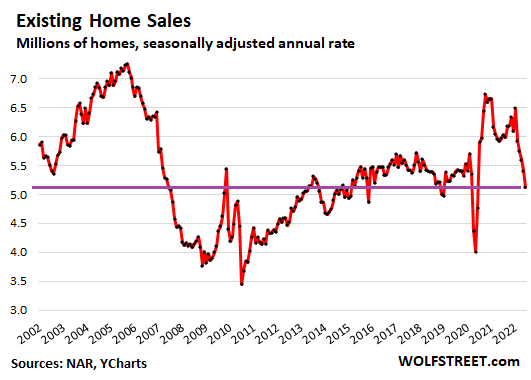
The seasonally adjusted annual rate of sales in June fell to 5.12 million homes, the lowest since the lockdown months in May, April, and June 2020 (historic data via YCharts):
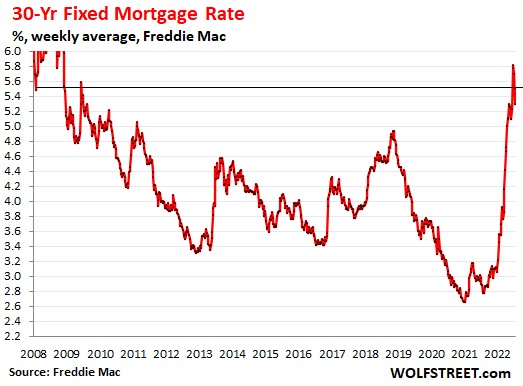
Holy-Moly Mortgage Rates in the driver’s seat.
I call them “holy-moly mortgage rates” because that’s the sound potential homebuyers utter when they see the mortgage payment needed to fund the ridiculously inflated price of the home they’re wanting to buy.
The average mortgage rate spiked to 5.5%, up from 2.9% a year ago, according to the most recent reading by Freddie Mac. It breached the 5% line in mid-April and has been in the 5.5% range since mid-June.
A 5.5% rate for a 30-year fixed rate mortgage, when CPI inflation is over 9%, is still mind-bogglingly low, and speaks of years of interest rate repression and QE by the Fed, which has bought, among other goodies, $2.7 trillion in mortgage-backed securities, thereby repressing mortgage rates. But QE has ended, and QT rules, and the Fed has started to shed its mortgage-backed securities, and mortgage rates have made the first steps toward some kind of normal level, except now prices are sky-high due to years of mortgage-rate repression, and the whole thing is out of whack:
As always when the market turns, supply that no one thought existed starts coming out of the woodwork.
The number of homes listed for sale in June jumped by 110,000 from May to 1.26 million, the highest since September, after having jumped by 113,000 in May and by 100,000 in April.
All last year, the industry lamented the “housing shortage” in order to hype up the price, when it was really a refusal by homeowners who’d bought another home to put their old and now vacant home on the market because they wanted to ride up the price spike all the way to the top. This has now been accomplished, and these vacant homes are appearing on the market
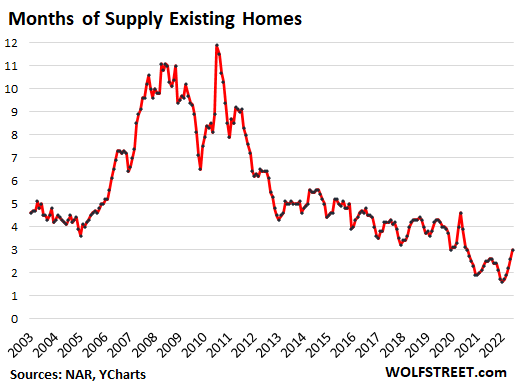
Supply of homes listed for sale jumped to 3.0 months, the highest since August 2020, and up by 20% from a year ago. Supply nearly doubled from the low in January (data via YCharts).
Sales by Region.
Sales dropped in all regions on a year-over-year basis. Note the 21.3% plunge in the West: In California, closed sales of houses plunged 21%, and closed sales of condos plunged by 27%. To show where this is headed in July: pending sales in California collapsed by 40%.
- Northeast: -11.8% yoy.
- Midwest: -9.6% yoy.
- South: -14.1 yoy.
- West: -21.3% yoy.
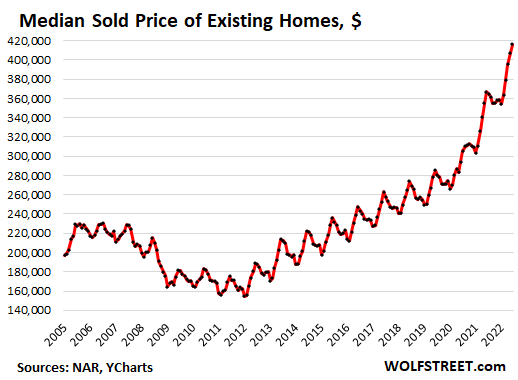
Median Price skewed by shift in mix to higher-end sales.
The median price rose to $416,000, up by 13.4% from a year ago, according to the NAR. And as we’ll see in a moment, the median price is skewed by changes in the mix, and there has been a huge shift in the mix to the higher end (data via YCharts):
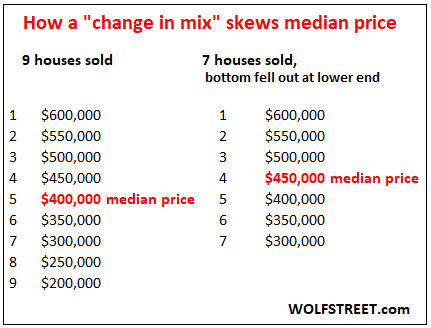
I’ll just repeat my favorite illustration: In a market where 9 homes sold, the median price is the price in the middle (fifth from the top). If only the top seven houses are sold, as the bottom fell out, the middle is now the fourth house down, or the fourth house up. This change in mix skews the metric of the median price, though the actual prices of the homes haven’t changed:
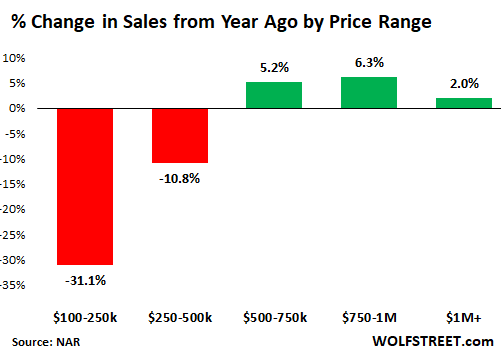
In the US market, the bottom has fallen out in sales of homes priced below $500,000, which accounted for 62% of total home sales in June.
But sales of homes above $500,000 have increased year-over-year. Sales of homes in the $500K-$750K range accounted for 20% of total sales; homes in the $750K-$1 million range accounted for 7%; and homes of $1 million and over accounted for 8% of sales.
And this big change in the mix – with fewer homes selling in the lower half and more homes selling in the higher half – skewed the median price upward. Sales by segment, according to the NAR:
And don’t blame the West for this shift in mix. In the high-priced West is where home sales plunged the most (21.3% year-over-year). Sales plunging faster in the high-priced West than in lower-priced regions would normally skew the median price down. So what we’re seeing is that the actual sales mix across the US is shifting, with higher-end buyers less impacted by the prohibitive affordability issues brought on by these holy-moly mortgage rates.
And no, investors, second home buyers, and all-cash buyers aren’t piling in: Their share remained steady.
Individual investors or second-home buyers purchased 16% of the homes in June, same as in May, and down from a share of 17% in April, 18% in March, 19% in February, and 22% in January, according to the NAR.
“All-cash” sales, which include many investors and second home buyers, remained at a share of 25% in June, same as in May, and down from a share of 26% in April. Their share has been in the same range for the past 12 months.
Enjoy reading WOLF STREET and want to support it? Using ad blockers – I totally get why – but want to support the site? You can donate. I appreciate it immensely. Click on the beer and iced-tea mug to find out how:

Would you like to be notified via email when WOLF STREET publishes a new article? Sign up here.
![]()
[ad_2]
Source link

Three Ways to Navigate 2023’s Greatest Unknowns.

Beijing unveils grand plan to grow digital economy as US moves forward with competition bill