Astonishing Charts from New York Fed Show the Dire Straits of U.S. Consumers During the 2008 Crash and Its Aftermath — Versus Today
By Pam Martens and Russ Martens: August 11, 2022 ~
At his July 27 press conference, Fed Chair Jerome Powell said this:
“Households are generally in about as strong a financial shape as they’ve been in a very long time – or perhaps ever given the money that’s on people’s balance sheets. So you have a pretty – from a financial stability standpoint – you have a pretty decent picture.”
That statement captures a rear view mirror look at U.S. households. The picture is deteriorating rapidly. More on that in a moment, but first a look at some hair-raising charts that capture the dire straits of U.S. households during the 2008-2010 financial crisis versus today. The New York Fed released its Household Debt and Credit Report for the second quarter of 2022 last week. It showed total household debt rising by $312 billion in the second quarter to reach an historic high of $16.10 trillion. Also setting a new historic record was mortgage debt, which climbed to $11.39 trillion and represented 70.5 percent of all household debt.
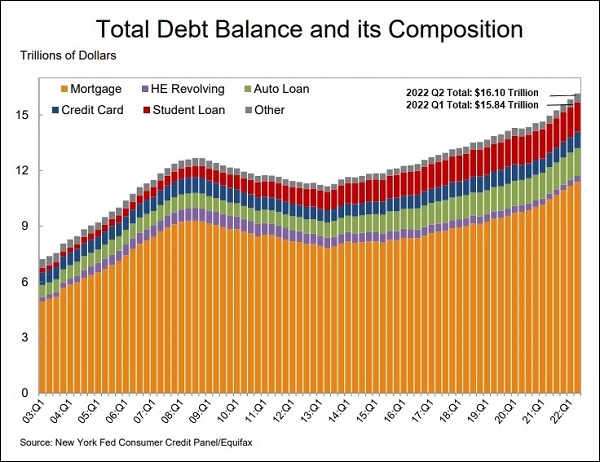
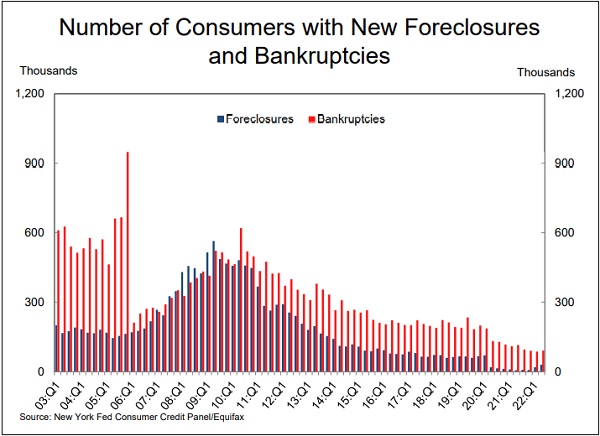
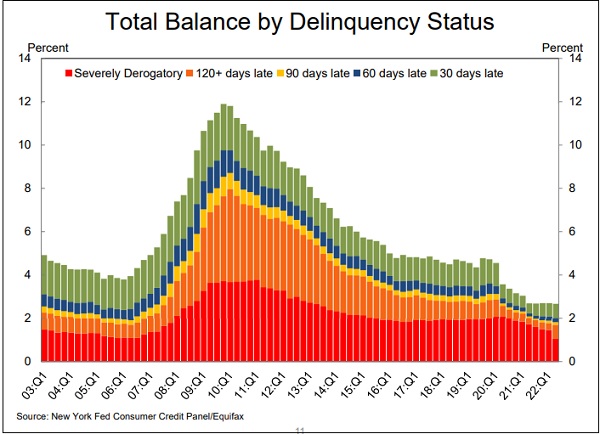
One would think that with historic levels of outstanding debt on household balance sheets, inflation at multi-decade highs and interest rates rising, one would be seeing dramatic increases in delinquencies on credit cards and mortgages, rising foreclosure rates and bankruptcy filings. But take a look at the charts below from the New York Fed’s report last week. Compared to the data on the charts for 2008 through 2010, it looks like a cakewalk today. In fact, the New York Fed report notes that “The share of mortgage balances 90+ days past due remained at 0.5%, near a historic low.”
What neither Fed Chair Powell nor the New York Fed report is telling the public is that things could deteriorate very fast without all that stimulus money and debt relief that Congress enacted to deal with the pandemic. One hint of that came from the following snippet in the New York Fed’s report:
“Although foreclosures have been very low due to the moratoria on new foreclosures and mortgage forbearances, 35,000 individuals saw new foreclosures on the credit reports, an increase from 24,000 in the previous quarter, an uptick potentially suggesting the beginning of a return to more typical levels.”
An increase from 24,000 foreclosures to 35,000 foreclosures is actually an increase of 45.8 percent in a three-month time span. That sounds pretty scary to us.
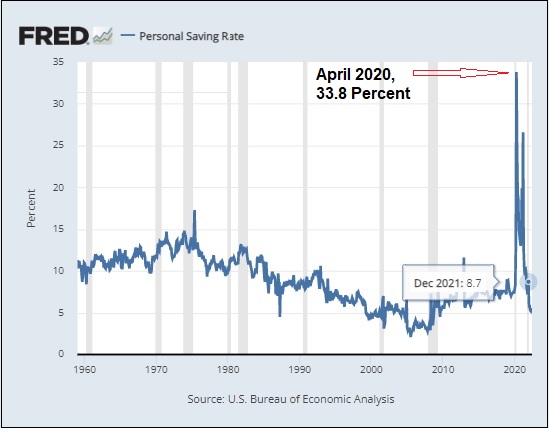
We decided to stroll over to the St. Louis Fed’s economic data bank known as “FRED” so see what the Bureau of Economic Analysis’s (BEA) Personal Saving Rate has looked like over the years and more recently. The BEA defines the Personal Saving Rate like this: “Income left over after people spend money and pay taxes is personal saving. The personal saving rate is the percentage of their disposable income that people save. This rate is followed to learn about Americans’ financial health and to help predict consumer behavior and economic growth.”
The Personal Saving Rate chart below helps to explain why Fed Chair Powell is able to brag about the financial health of U.S. households: they were put on the same kind of feeding tube from the U.S. government during the heights of the pandemic as the Fed put Wall Street banks on during the financial crash of 2008, a time when Congress let tens of millions of Americans left jobless from the crash fend for themselves with no lifeline. As Senator Bernie Sanders summed up the 2008 to 2010 financial crash era: “This is a clear case of socialism for the rich and rugged, you’re-on-your-own individualism for everyone else.”
As the chart below illustrates, the personal savings rate in the U.S. spiked to the highest levels in 60 years from the stimulus checks that were issued to Americans in 2020 and 2021; the Child Tax Credit payments issued monthly from July 15 to December 15, 2021; and various forms of debt relief. (According to a Brookings study, “between March 2020 and May 2021, more than 70 million consumers with loans worth $2.3 trillion entered forbearance, missing $86 billion of their payments. During that period, 6.3 million mortgages, 11 million auto loans, 68 million student loans, and 62 million revolving loans (such as credit cards) were in forbearance.)”
But as the government’s financial assistance has ended, the personal saving rate has plunged, moving from a historic high of 33.8 percent in April of 2020 to 8.7 percent in December 2021; to 5.8 percent in January of 2022; to the most recent reading from the Bureau of Economic Analysis of 5.1 percent in June of this year.
Adding to the tenuous financial picture of U.S. households, Bankrate conducted a survey this past January, which found that a majority of Americans (56 percent) would be unable to cover an unexpected expense of $1,000 should an emergency arise. Of those surveyed, 20 percent said they would have to put the charge on a credit card and pay it over time. That might explain why balances on credit cards are also hitting historic highs. According to the New York Fed report, “Credit card balances saw a $46 billion increase since the first quarter – although seasonal patterns typically include an increase in the second quarter, the 13% year-over-year increase marked the largest in more than 20 years.”
[ad_2]
Source link
Washington's Fiscal Blowout: Interest on Federal Debt Has Hit 15.5% Of All Federal Debt

An esoteric oil gauge has spiked to an unprecedented level