Revised Q2 GDP Surprises With Unexpectedly Hot Personal Consumption, Core PCE
Traditionally the third and final US GDP estimate is the most irrelevant and meaningless economic data print as it looks at a data point that was relevant some 3 months ago, but today may have been an exception because alongside the actual data the BEA release comprehensive data revisions going back years, which materially changed some of the US economic make up, if not the bottom line number: the BEA reported that (after two revisions), the Q2 GDP dropped -0.6%, in line with expectations and unchanged from the previous, 2nd estimate.

But while the headline GDP number was unchanged from the previous estimate, personal consumption was notably revised to have risen 2.0% in 2Q after rising 1.3% prior quarter, its contribution to the bottom-line change in GDP at 1.38% in 2Q, up from 0.99% one month ago and almost double the initial Q2 personal consumption estimate of 0.70% back in July. This means that the BEA has pulled much more spending from the current quarter into Q2 and Q3 – and Q4 – are going to get really messy.
Among the other updates to the GDP data, the biggest change was the upward revision to consumer spending that was offset by a downward revision to exports. Imports were revised down
Looking at the details, we find the following change:
- Personal Consumption contributed 1.38% to the bottom line, up from 0.99% in the 2nd estimate
- Fixed investment subtracted -0.92%, vs -0.84% last
- The change in private inventories subtracted -1.91% vs -1.83% last
- Net exports (exports less imports) added 1.16% to the bottom line number, vs 1.43% last. With the dollar exploding higher, don’t expect this to be repeated.
- Government consumption was flat at -0.29%, vs -0.32% last.
Some more details on the qualitative changes:
- The decrease in inventory investment primarily reflected a decrease in retail trade (led by “other” general merchandise stores).
- The decrease in housing investment primarily reflected a decrease in brokers’ commissions.
- The decrease in federal government spending primarily reflected a decrease in nondefense spending.
- The decrease in state and local government spending was led by a decrease in investment in structures (notably, educational and highway and street structures).
- The increase in imports reflected an increase in services (led by travel).
- The increase in exports reflected increases in both goods (led by industrial supplies and materials) and services (led by travel).
- The increase in consumer spending reflected an increase in services (led by food services and accommodations as well as “other” services) that was partly offset by a decrease in goods (led by food and beverages).
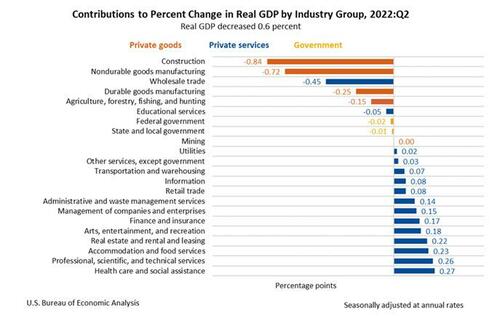
Today’s release includes estimates of GDP by industry, or value added—a measure of an industry’s contribution to GDP. Private goods-producing industries decreased 10.4 percent, private servicesproducing industries increased 2.0 percent, and government decreased 0.2 percent. Overall, 9 of 22 industry groups contributed to the second-quarter decline in real GDP.
- The decrease in private goods-producing industries primarily reflected decreases in construction and nondurable goods manufacturing (led by chemical products manufacturing).
- The increase in private services-producing industries primarily reflected increases in health care and social assistance (led by hospitals); professional, scientific, and technical services (led by computer systems design); real estate and rental and leasing (led by real estate); and accommodation and food services (led by food services). Partly offsetting these increases was a decrease in wholesale trade.
- The decrease in government reflected decreases in federal (led by federal government enterprises) as well as state and local governments.
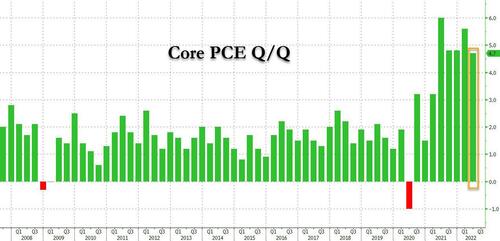
Finally, there was another key post-revision surprise: the headline price index rose 9.0%, above the 8.9% estimate, while core PCE increase 4.7%, also above the 4.4% estimate.
In kneejerk reaction, S&P futures extended losses after the revised GDP data signaled the Fed will likely need to keep tightening, due to the hotter-than-expected 2Q core PCE and personal consumption figures. Also, as noted earlier, weekly jobless claims unexpectedly fell to the lowest since April as well, another sign the labor market remains tight.
Of course, the GDP data is dramatically backward looking which is why we expect the market’s fascination with the stronger components to fade quickly as attention then turns to just how ugly the GDP will be in the current quarter. And speaking of that, we will get the final Q3 Atlanta GDP print tomorrow: as of Sept 27 it was 0.3%. The question is whether the data since then was ugly enough to push it into red signifying a 3rd consecutive quarter of declining GDP which not even Biden will be able to pretend is not a recession.
[ad_2]
Source link

Platinum demand predicted to surge this year, leaving a near 1-million-ounce deficit

Mohamed El-Erian says the market is seeing right through the Federal Reserve’s attempt to “fool” the market