The Fed’s Liabilities under QT: November Update
Total liabilities dropped by $344 billion since QT began. Big shifts between liabilities: reserves already plunged by $1.12 trillion.
By Wolf Richter for WOLF STREET.
We generally discuss the Fed’s assets on its balance sheet: Treasury securities, MBS, repos, etc. But today, we’re going to look at the four major liabilities on the Fed’s balance sheet. On every balance sheet, total assets = total liabilities + capital (the Fed’s capital is limited by Congress, currently $42 billion).
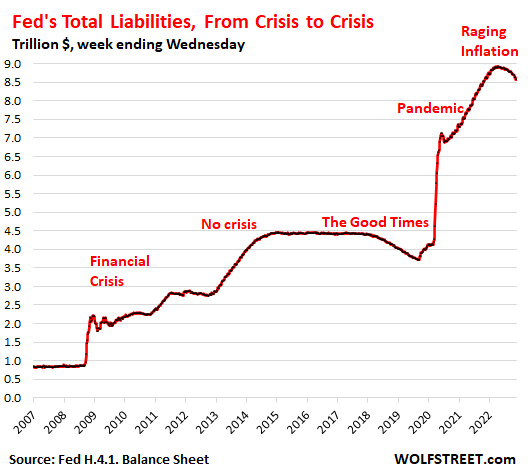
Total liabilities dropped to $8.58 trillion, according to the Fed’s weekly balance sheet released a day later than normal, on Friday, due to Thanksgiving. This was down by $344 billion from the peak on April 13, 2022, and the lowest since November 3, 2021. Total liabilities mirror the Fed’s total assets (minus $42 billion in capital).
But there are big shifts in the composition of those liabilities, which is what we’re going to look at in a moment, involving banks, Treasury money market funds, the amazingly record-popular US paper dollars, and the government’s checking account:
Reserves plunged by $1.12 trillion since December 2021.
Reserve balances – cash that banks put on deposit at the Fed to earn interest, similar to a big savings account – plunged by $1.12 trillion from the peak in December 2021. Late 2021 was when the Fed began “tapering” its QE asset purchases, and QE ended in March 2022.
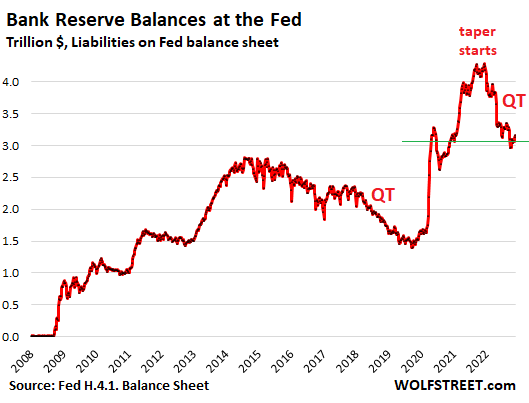
Banks use their reserve accounts at the Fed to transfer money between banks and to do business with the Fed, such as selling securities to the Fed under QE. Reserves are a liability on the Fed’s balance sheet; they’re money that the Fed owes the banks.
Reserves are the most liquid, risk-free interest-paying asset banks can invest in, and they also figure into the banks’ regulatory capital.
The Fed, as of the last FOMC meeting, pays the banks 3.9% interest on reserves. Alternatively, banks can invest their excess cash by buying Treasury securities, and they’re doing that. The one-month Treasury yield is currently 4.16%, but these securities are less liquid than reserves; they have to be sold in order to be turned into cash, while reserve accounts are like a savings account that banks can just draw on.
The banks, on their own balance sheets, don’t call these reserves “reserves.” That’s a Fed term. Banks carry them as assets and call them “interest-earning deposits,” “interest-earning cash” or similar.
Reserves are a manifestation of liquidity in the banking system that is not chasing after other assets.
QT is draining liquidity from the financial system, and one of the places where the liquidity drain shows up is in reserves.
But the $1.12-trillion plunge in reserves is far larger than the $344 billion decline in the Fed’s overall assets and liabilities under QT. This means that banks are now chasing after other options that are paying higher yields than reserves, and these options include Treasury securities.
Reserves, bank deposits, and competition for cash (which is no longer trash).
This bank-cash put on deposit at the Fed represents only a small portion of the cash that the banks received from their customers’ deposits. [For banks, a customer deposit is two things on its books: the amount owed the customer (a liability); and the amount in cash received from the customer (an asset). To earn income with this cash, a bank buys securities, or puts the cash on deposit at the Fed, or makes loans, etc. It also has to keep some on hand to process transactions, meet withdrawals, etc.]
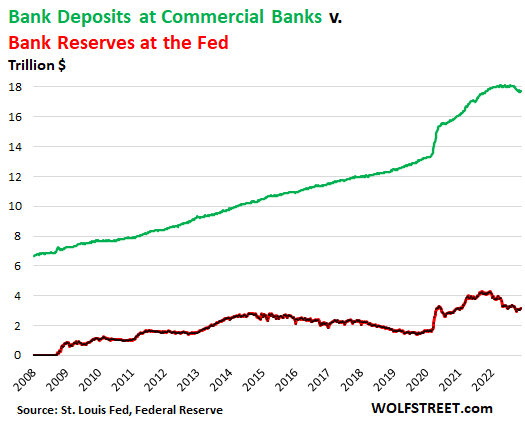
Total deposits (the liability) at all US commercial banks dropped by $433 billion from the peak in April 2021, to $17.7 trillion. In other words, customers lent banks $17.7 trillion in cash, via savings products and transaction accounts, such as individual and business checking accounts, corporate payroll accounts, and corporate accounts that suddenly and briefly swell with cash when major transactions take place, such as the purchase of a company involving billions of dollars in cash.
But customers are now finding better use for some of their cash than depositing it at the bank and earning nearly no yield, while for example shorter-term Treasury securities now pay over 4%, and so they’ve pulled $433 billion in cash out of banks since April.
Banks have begun to fight back to stop this cash drain, and they now offer CDs – usually brokered CDs that you can buy only through your broker, not a the bank itself – of 4% and more. Some savings accounts are now at 3% or higher – a sign that there is now finally some competition for cash as the era of free money has ended and cash is suddenly no longer trash but in demand.
This chart shows total deposits at all commercial banks (green) and the portion of the cash from those deposits that banks put on deposit at the Fed (red):
Overnight Reverse Repurchase agreements.
The Fed currently pays 3.8% on what it calls overnight “reverse repurchase agreements” (RRPs). Under these RRPs, the Fed takes in cash and hands out collateral (Treasury securities). RRPs are a liability for the Fed because it’s cash the Fed owes its counterparties.
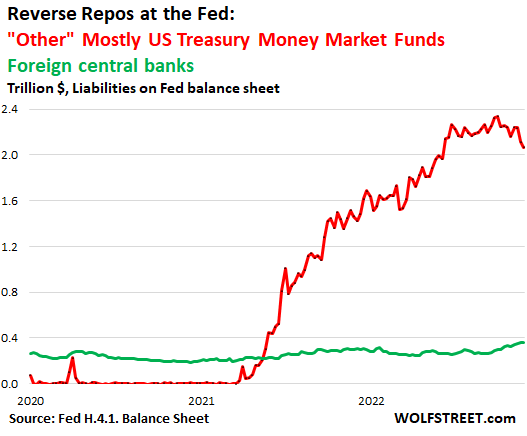
The Fed offers RRPs to two groups: foreign official accounts, where other central banks park their dollar cash; and “other” accounts, mostly US Treasury Money Market funds. The total balance of both combined dropped by $208 billion from the peak in April, to $2.43 trillion.
But wait…
Foreign official RRPs shot up by between $60 billion and $80 billion from the range early this year, to $361 billion, which was, along with the prior week, the highest ever.
“Other” overnight RRPs dropped by $269 billion from the peak in September, to $2.03 trillion, the lowest since June. This means that Treasury money market funds have less need to park excess cash at the Fed:
Starting in the spring 2021, Treasury money market funds got flooded with cash. They normally buy Treasury securities with short maturities, but demand was so high that short-term yields dropped briefly below 0% in early 2021, which could have caused money market funds to “break the buck,” where a unit’s value drops below $1, which could trigger a run on the fund, and contagion could spread from there, which is why the Fed started offering RRPs, and then started paying interest on them.
And earlier this year, when the Fed started raising rates, but banks still paid near 0% on deposits, Treasury money market funds started to shift their short-term cash on hand from their bank accounts to RRPs, because the Fed pays higher interest than the banks.
So…
- Reserves, as we’ve seen above, peaked in December 2021.
- “Other” RRPs seem to have peaked in September 2022.
- RRPs with central banks, though relatively small, have surged to a record.
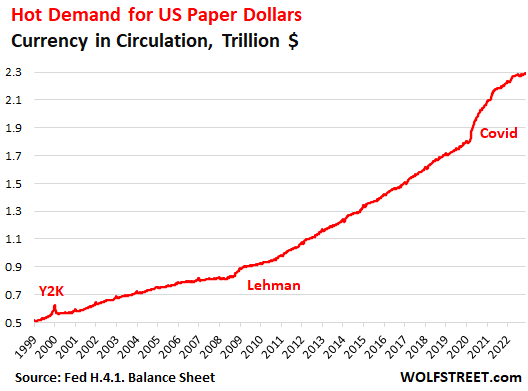
The beloved Paper Dollars.
Currency in circulation – the paper dollars in wallets and under mattresses – is demand-based through the US banking system. If customers demand paper dollars at the ATM or at the counter, the bank must have enough on hand. Foreign banks have relationships with US banks to get dollars for their customers.
Banks get those paper dollars from the Fed in exchange for collateral, such as Treasury securities, which are assets for the Fed.
Officially called “Federal Reserve Notes,” they’re a liability for the Fed, essentially money it borrows from the holders.
Before QE, currency in circulation was the primary driver of the increase in assets on the Fed’s balance sheet through the collateral that banks have to post to get FRNs.
And demand has been huge – but not for payment purposes, for which demand is declining. Paper dollars are stashed around the world for legal and illegal purposes, and when there is fear of a crisis, demand surges.
Currency in circulation spiked throughout the pandemic and now reached a new record of $2.29 trillion, up by $501 billion from pre-pandemic February 2020:
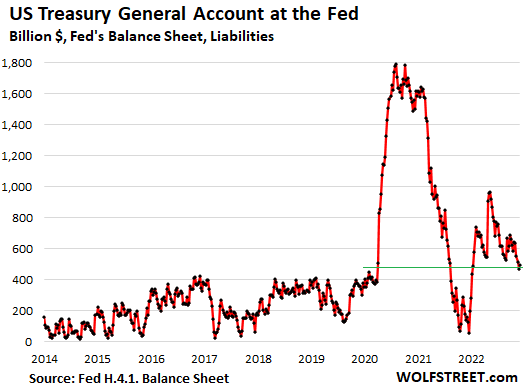
The Treasury General Account.
The government’s checking account is at the Federal Reserve Bank of New York. The amount that the government has in the Treasury General Account (TGA) is money the Fed owes the government, and is a liability for the Fed.
The balance has been swinging majestically, from lows during debt-ceiling fights when the government nearly runs out of cash, to the high in July 2020, after the government raised gigantic amounts of cash through gigantic debt issuance to pay for the stimulus programs.
Inflation also has an impact over the years: it drives up outlays, and the larger outflows require larger balances to avoid running out of cash on particular days.
The TGA balance ticked up a tad to $493 billion, from the prior week, which at $472 billion, had been the lowest since January 2022. Account balances are now in the process of normalizing after the craziness starting in the spring of 2020:
Enjoy reading WOLF STREET and want to support it? You can donate. I appreciate it immensely. Click on the beer and iced-tea mug to find out how:

Would you like to be notified via email when WOLF STREET publishes a new article? Sign up here.
![]()
[ad_2]
Source link

Silver Viking ingot found in Burton field declared as treasure

Add 4,281 Hedge Fund Clients to What Makes JPMorgan Chase the Riskiest Mega Bank in the U.S.