Fed’s Balance Sheet Drops by $381 Billion from Peak: December Update on QT
Keeping an eye on stuff, including dollar liquidity swaps and Primary Credit.
By Wolf Richter for WOLF STREET.
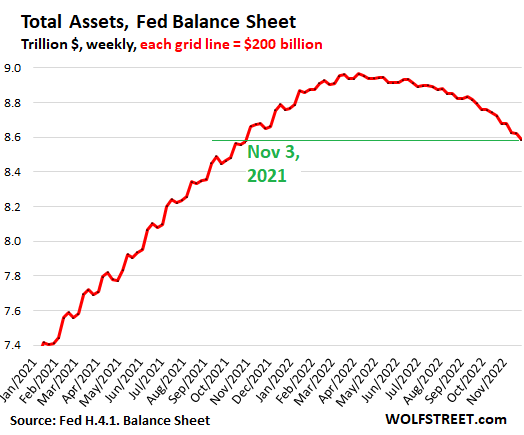
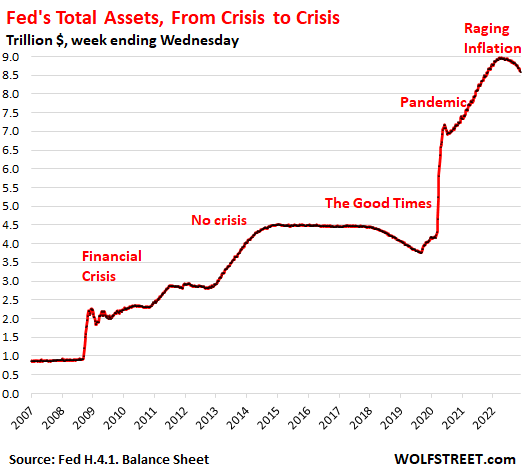
Since the peak in April, total assets on the Federal Reserve’s balance sheet dropped by $381 billion, to $8.585 trillion, the lowest since November 3, 2021, according to the weekly balance sheet released today, with balances as of November 30.
Compared to four weeks ago (balance sheet released on November 3), total assets dropped by $92 billion.
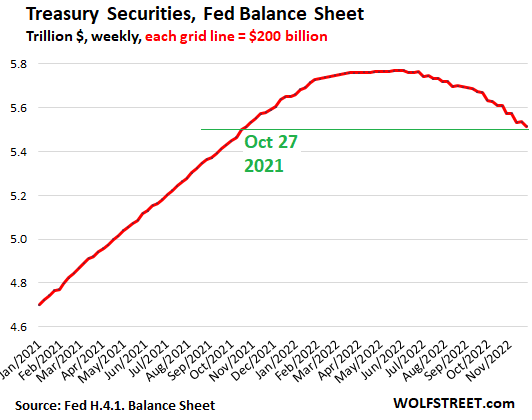
Treasury securities: Down $255 billion from peak.
Treasury securities mature mid-month and at the end of the month and roll off the Fed’s balance sheet at that time.
Since the peak on early June, Treasury holdings fell by $255 billion to $5.516 trillion, the lowest since October 27, 2021.
Over the past four weeks since the November 3 balance sheet, the Fed’s holdings of Treasury securities fell by $59 billion:
- $60 billion of Treasury securities (at the monthly cap of $60 billion)
- Minus $1 billion in inflation compensation the Fed received for its Treasury Inflation Protected Securities (TIPS). Inflation compensation is not paid in cash but is added to the principal of the TIPS, which increases the TIPS balance.
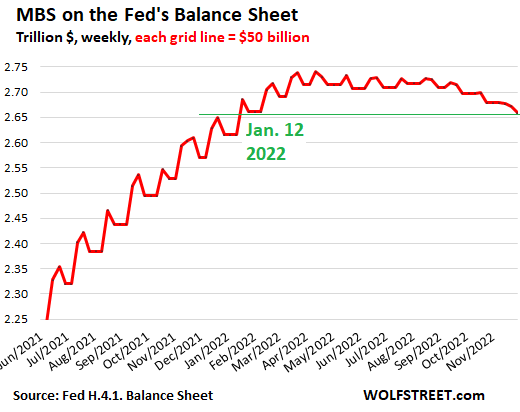
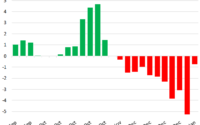
Mortgage-backed securities: Down $81 billion from peak.
Since the peak, the balance of MBS dropped by $81 billion, to $2.659 trillion. Over the past four weeks, the balance dropped by $20 billion, below the cap of $35 billion.
The problem with MBS is that they come off the balance sheet largely via pass-through principal payments, and those have turned from a torrent into a trickle after mortgage rates spiked and mortgage payoffs plunged as sales of existing homes plunged and as refinancings of existing mortgages collapsed.
In mid-September, the Fed stopped buying MBS after having already cut its purchases to near nothing. Given the delays associated with MBS that the Fed bought in the To-Be-Announced market, the inflow of new MBS onto the balance sheet ended in October. These inflows are the upward zigs in the chart.
The downward zags are the weeks when the pass-through principal payments reached the Fed and reduced the principal balance of the MBS holdings.
The resulting zigzag line has gotten ironed out, as the upward zigs have ended and the downward zags have dwindled due to the drop in mortgage payoffs.
Various Fed governors have mentioned the possibility of selling MBS outright to get to somewhere near the cap of $35 billion a month – which means that the Fed might have to sell about $15 billion a month in MBS. I’m eagerly awaiting some official mention in the meeting minutes about it, likely sometime next year.
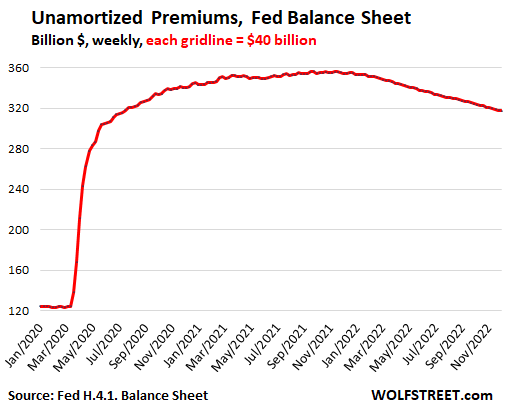
Unamortized Premiums: Down $39 billion from peak.
The Fed bought its securities in the secondary market, and when market yields were lower than the coupon interest of the bonds, the Fed, like everyone else, had to pay a “premium” over face value.
The Fed books the face value in the regular accounts, and it books the “premiums” in an account called “unamortized premiums.” It then amortizes the premium of each bond to zero over the remaining maturity of the bond. By the time the bond matures, and the Fed receives face value for the bond, the premium has been fully amortized.
Unamortized premiums have dropped by $39 billion from the peak in November 2021, to $317 billion:
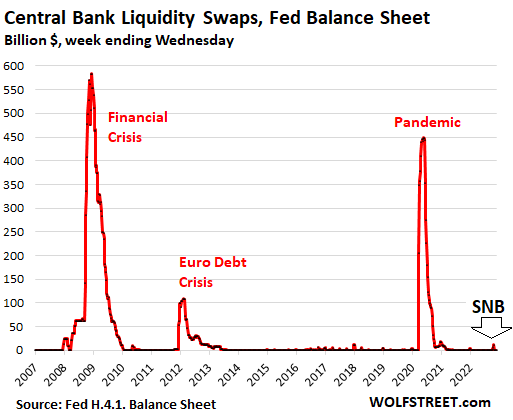
Keeping an eye on the Central Bank Liquidity Swaps
Starting on September 14, the Swiss National Bank used the long-standing swap line with the Fed for five 7-day dollar-swaps in a row. The last and largest swap amounted to $11.1 billion, which matured on October 27. Since then, there have been no swaps with the SNB, and the balance with the SNB has been $0. The SNB likely did this to provide short-term dollar-liquidity to Credit Suisse, which had come under attack by a massive outflow of funds.
We’ll keep an eye on liquidity swaps.
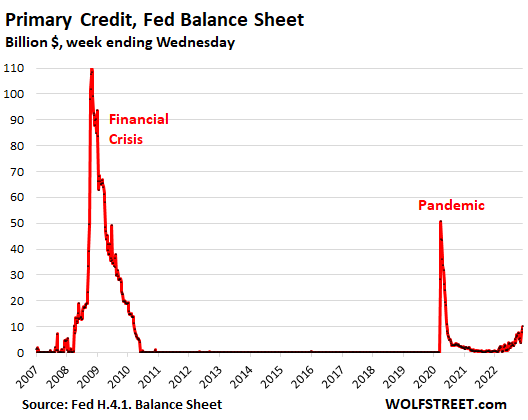
Keeping an eye on “Primary Credit.”
The Fed lends money to the banks and currently charges 4.0% interest on these loans at the “Discount Window.”
When the Fed started hiking rates in early 2022, Primary Credit began rising. On today’s balance sheet, the total Primary Credit outstanding rose to $10 billion. Keeping an eye on it:
QE created money, QT destroys money.
With QT, the Fed destroys the money that it had created with QE. QT works in the opposite direction and does the opposite of QE, but relies on a different mechanism. With QE, the Fed created money and used this money to purchase securities via its primary dealers, which then used this money to buy other stuff with, and the money began to circulate.
For QT, the Fed doesn’t sell securities to the primary dealers. Instead, when Treasury securities mature, the Fed gets paid face value from the government, and the Fed then destroys this money. With MBS, the Fed destroys the money from the pass-through principal payments.
QE caused a huge bout of asset price inflation – and finally contributed to raging consumer price inflation. QT, though it’s slower than QE, will be causing the opposite, and we can already see the effects, with bond and stock prices down substantially from a year ago, crypto imploding, and home prices starting to fall.
And how we got to Raging Inflation:
Enjoy reading WOLF STREET and want to support it? You can donate. I appreciate it immensely. Click on the beer and iced-tea mug to find out how:

Would you like to be notified via email when WOLF STREET publishes a new article? Sign up here.
![]()
[ad_2]
Source link
Bank of England Sold All Bonds it Bought Last Fall amid Pension Crisis, First Big Central Bank to Sell Government Bonds Outright

The Current Yield Curve Inversion, Explained