November Payrolls Unexpectedly Smash Expectations As Hourly Earnings Jump
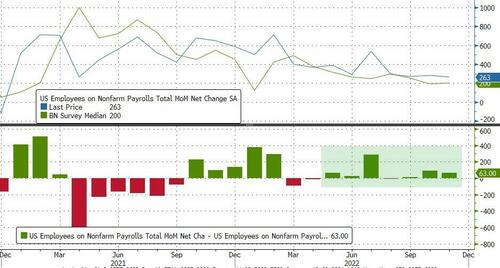
It was supposed to be the lowest payrolls report since December 2020 and… it was, but not how the market expected. With consensus expecting a 200K print (and whisper predicting much lower amid the mass tech layoffs), virtually nobody – not even Goldman – expected anything resembling a beat. And while we did in fact get the weakest print since Dec 2020 (and tied with March 2021), the report was a completely unexpected beat to expectations, coming in at +263K, this was a huge beat to expectations of 200K (the 7th consecutive beat) and just barely a drop compared to the upward revised 284K last month.
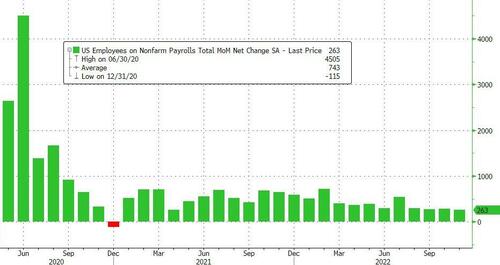
The change in total nonfarm payroll employment for September was revised down by 46,000, from +315,000 to +269,000, and the change for October was revised up by 23,000, from +261,000 to +284,000. With these revisions, employment gains in September and October combined were 23,000 lower than previously reported
Monthly job growth has averaged 392,000 thus far in 2022, compared with 562,000 per month in 2021. In November, the biggest job gains occurred in leisure and hospitality (bartenders and waiters), health care, and government. Employment declined in retail trade and in transportation and warehousing.
As noted, this was the 7th consecutive payrolls beat of expectations in a row!
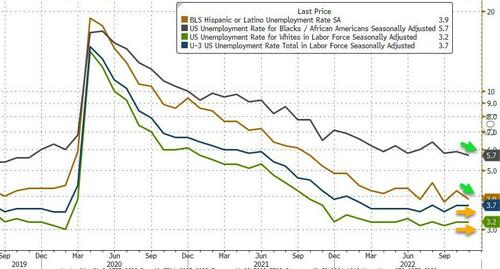
The unemployment rate was unchanged at 3.7% in November, in line with expectations, and has been in a narrow range of 3.5% to 3.7% since March. The number of unemployed persons was essentially unchanged at 6.0 million in November. Among the major worker groups, the unemployment rates for adult men (3.4 percent), adult women (3.3 percent), teenagers (11.3 percent), Whites (3.2 percent), Blacks (5.7 percent), Asians (2.7 percent), and Hispanics (3.9 percent) showed little or no change over the month. (See tables A-1, A-2, and A-3.)
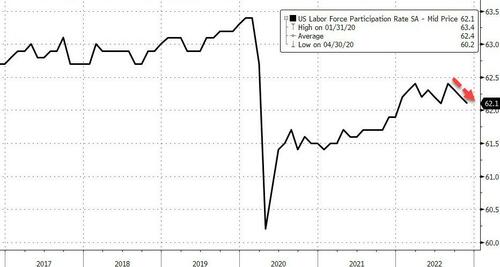
Both the labor force participation rate, at 62.1 percent, and the employment-population ratio, at 59.9 percent, were little changed in November and have shown little net change since early this year.
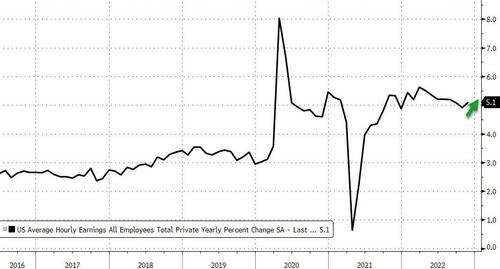
But what was the most troubling update is that wages came in red hot again, with average hourly earnings for all employees on private nonfarm payrolls rising by 18 cents, or 0.6% to $32.82, double the expected 0.3% growth . Over the past 12 months, average hourly earnings have increased by 5.1% which was also above the 4.6% expected.
Here is Cornerstone Financial’s Cliff Hodge on the earnings data: “While the headline payrolls number was strong, the wage data is going to be eye-popping for the Fed. The 0.6% month-over-month wage growth number matched the highest level all year. Higher wages feed into higher inflation, which will no doubt keep pressure on the Fed and should increase expectations for the terminal rate. We got no help from the participation rate, which continues to move in the wrong direction and will keep competition for labor high until the economy inevitably rolls over sometime next year.”
In November, the average workweek for all employees on private nonfarm payrolls declined by 0.1 hour to 34.4 hours. In manufacturing, the average workweek for all employees decreased by 0.2 hour to 40.2 hours, and overtime declined by 0.1 hour to 3.1 hours. The average workweek for production and nonsupervisory employees on private nonfarm payrolls decreased by 0.1 hour to 33.9 hours.
Some more details:
- Among the unemployed, the number of permanent job losers rose by 127,000 to 1.4 million in November. The number of persons on temporary layoff changed little at 803,000.
- The number of long-term unemployed (those jobless for 27 weeks or more) was little changed at 1.2 million in November. The long-term unemployed accounted for 20.6 percent of all unemployed persons.
- The number of persons employed part time for economic reasons was about unchanged at 3.7 million in November. These individuals, who would have preferred full-time employment, were working part time because their hours had been reduced or they were unable to find full-time jobs.
- The number of persons not in the labor force who currently want a job was little changed at 5.6 million in November and remains above its February 2020 level of 5.0 million. These individuals were not counted as unemployed because they were not actively looking for work during the 4 weeks preceding the survey or were unavailable to take a job.
- Among those not in the labor force who wanted a job, the number of persons marginally attached to the labor force held at 1.5 million in November. These individuals wanted and were available for work and had looked for a job sometime in the prior 12 months but had not looked for work in the 4 weeks preceding the survey. The number of discouraged workers, a subset of the marginally attached who believed that no jobs were available for them, was 405,000 in November, little changed from the previous month.
Drilling down into the BLS’s establishment survey fabulation we get the following ridiculous modeled “data”:
- Leisure and hospitality added 88,000 jobs in November, including a gain of 62,000 in food services and drinking places. Leisure and hospitality has added an average of 82,000 jobs per month thus far this year, less than half the average gain of 196,000 jobs per month in 2021.
- In November, employment in health care rose by 45,000, with gains in ambulatory health care services (+23,000), hospitals (+11,000), and nursing and residential care facilities (+10,000).
- Government added 42,000 jobs in November, mostly in local government (+32,000). Government employment has increased by an average of 25,000 per month thus far this year, compared with 38,000 per month in 2021. Since February 2020, government employment is down by 461,000, or 2.0 percent.
- In November, employment in the other services industry rose by 24,000, as personal and laundry services added 11,000 jobs over the month. Other services employment has increased by an average of 15,000 per month thus far this year, compared with 24,000 per month in 2021. Employment in other services is below its February 2020 level by 186,000, or 3.1 percent.
- Employment in social assistance increased by 23,000 in November and has returned to its February 2020 level. Within social assistance, employment in individual and family services increased by 17,000 in November. Job growth in social assistance has averaged 18,000 per month thus far in 2022, compared with an average of 13,000 per month in 2021.
- Construction employment continued to trend up in November (+20,000), with nonresidential building adding 8,000 jobs. Construction has added an average of 19,000 jobs per month thus far this year, little different from the 2021 average of 16,000 per month.
- Employment in information rose by 19,000 in November. Employment in the industry has increased by an average of 14,000 per month thus far this year, in line with the average of 16,000 per month in 2021.
- Manufacturing employment continued to trend up in November (+14,000). Job growth has averaged 34,000 per month thus far this year, little different from the 2021 average of 30,000 per month.
- In November, employment in financial activities continued its upward trend (+14,000). Job gains in real estate and rental and leasing (+13,000) and in securities, commodity contracts, and investments (+6,000) were partially offset by a decline in credit intermediation and related activities (-9,000). Employment in financial activities has increased by an average of 12,000 per month thus far this year, the same as in 2021.
- Employment in retail trade declined by 30,000 in November. Job losses in general merchandise stores (-32,000), electronics and appliance stores (-4,000), and furniture and home furnishings stores (-3,000) were partially offset by a job gain in motor vehicle and parts dealers (+10,000). Retail trade employment has fallen by 62,000 since August.
- Employment in transportation and warehousing declined by 15,000 in November and has decreased by 38,000 since July. In November, job losses in warehousing and storage (-13,000) and in couriers and messengers (-12,000) were partially offset by a job gain in air transportation (+4,000).
- Employment in professional and business services changed little in November (+6,000). Within the industry, professional and technical services added 28,000 jobs, while business support services lost 11,000 jobs. Monthly job growth in professional and business services has averaged 58,000 thus far in 2022, down from 94,000 per month in 2021.
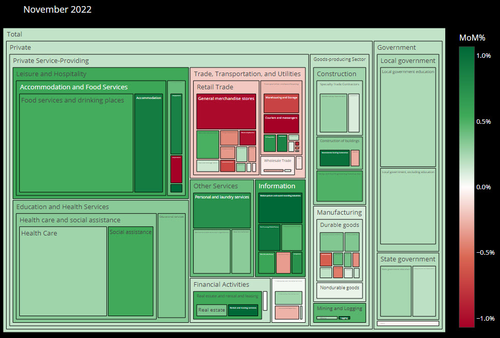
And a visual heatmap of jobs courtesy of Bloomberg:
Needless to say this report, clearly politically motivated in light of everything else taking place in the economy, has put the Fed in a corner: while most other economic indicators scream recession, Biden’s last economic silver lining – the labor market – continues to come in far hotter than expected, and as such it forces Powell to keep tightening until such time as the bottom falls out of the economy and the US goes straight from expansion to depression, skipping recession completely.
Matt Maley, chief market strategist for Miller Tabak agrees: “The number one issue for the Fed has been wage inflation. Today’s much higher than expected data on average hourly earnings shows that it is still a big problem. This will prolong the Fed’s current tightening policy.”
As BBG economist Anna Wong notes, “The robust November jobs report reinforces a point Fed Chair Jerome Powell made in his Nov. 30 speech: Signs that wage growth is moderating are only ‘tentative.’ The resurgence of average hourly earnings growth shows labor shortages are still pressuring inflation, pushing back against the idea — supported by a few Fed officials, as indicated in the November FOMC minutes — that wage growth is cooling fast. Given the slow adjustment in the labor market, Fed officials will likely have to raise their terminal-rate forecast from what they wrote down in the September dot plot.”
And in keeping with the market reaction matrix we shared earlier, the kneejerk reaction for all risk assets – stocks, TSYs, gold, and crypto – is uniformly lower.
[ad_2]
Source link

“Housing Recession”: NAHB. Homebuilders Cut Prices as Traffic of Prospective New-House Buyers Plunges, Cancellations Spike
What The FTX Just Happened??