Is it Time to Drop the “L” in the BLS?

By all measures, the latest job report absolutely blasted past expectations with one of the biggest upside surprises in recent memory. The current month came in at 517k, but even that massive figure was beaten by the latest Household Survey which showed 894k jobs created in January.
As shown below, the Household Survey report had been coming in below the Headline number fairly consistently for months until December. December and now January has beaten the Headline number by quite a large margin.
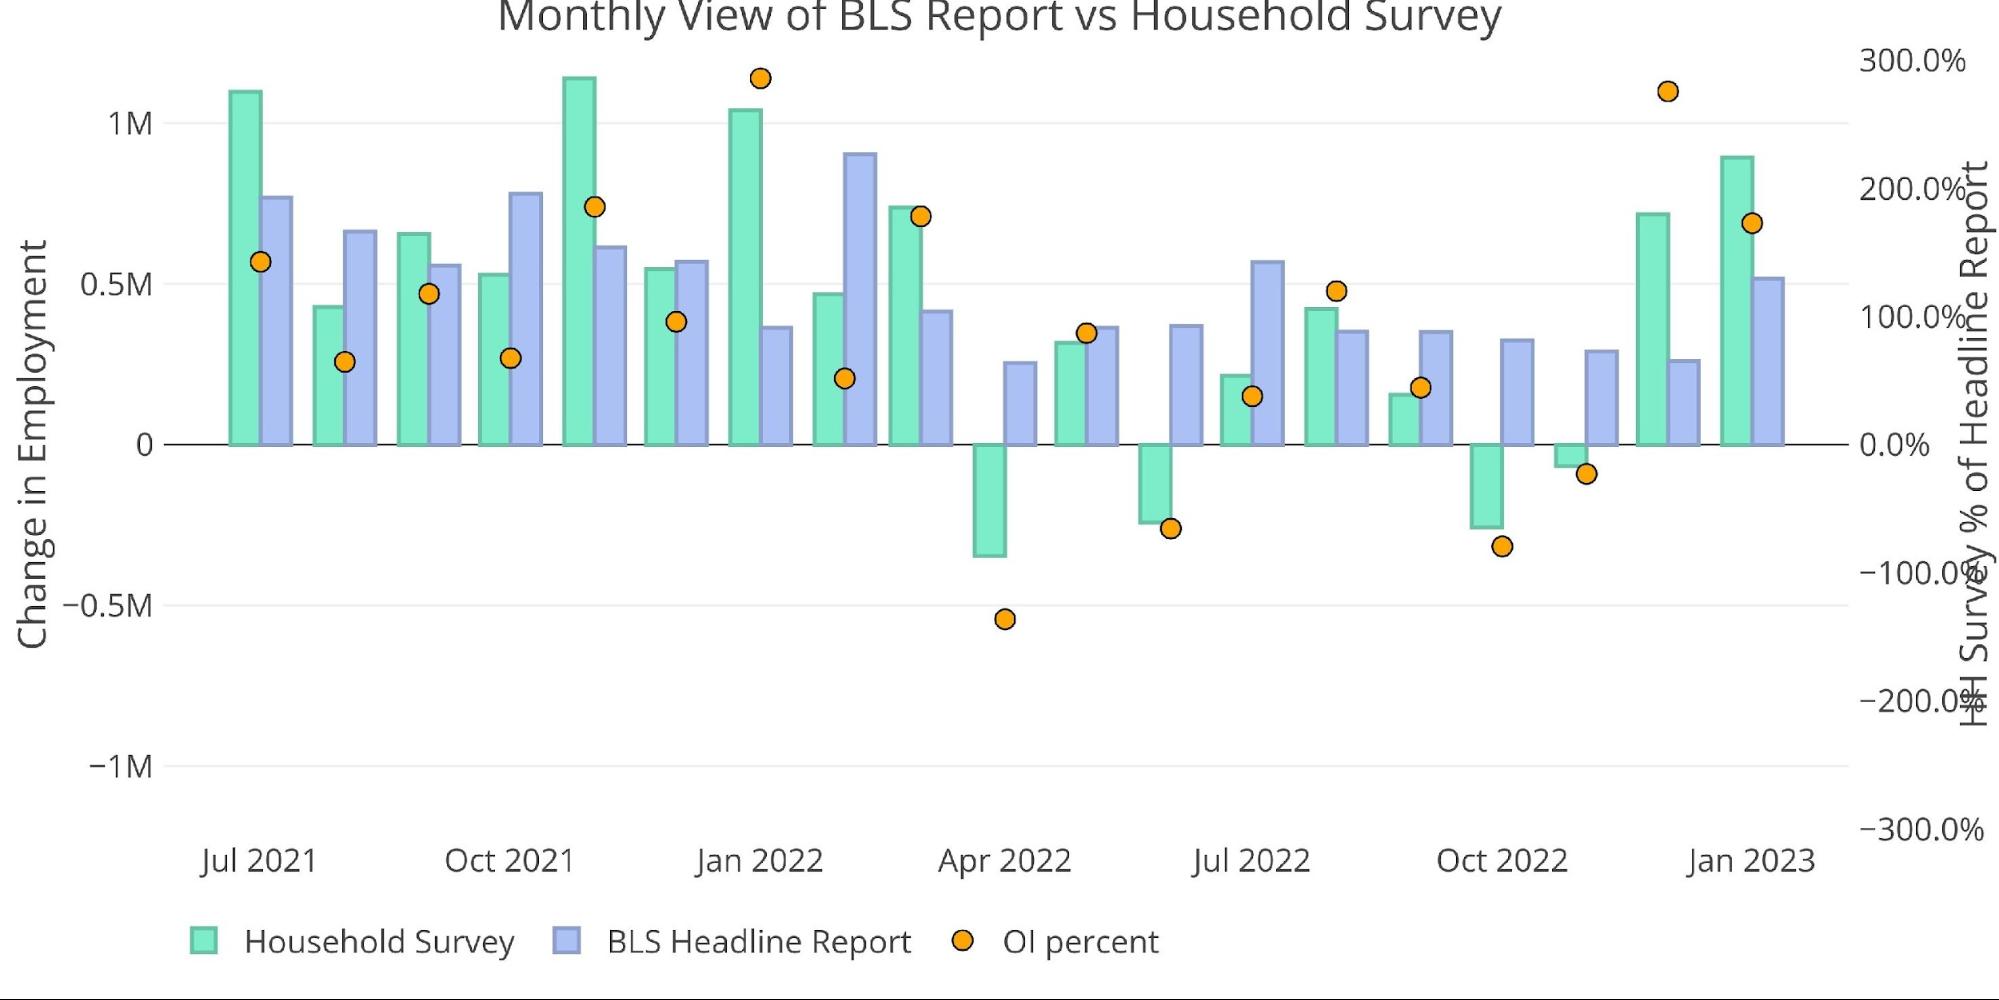
Figure: 1 Primary Report vs Household Survey – Monthly
Looking on an annual basis, the household numbers are currently 73% above the Headline survey which would crush the previous record in 2018 of 27.5% if the trend held. Considering it’s only January, it’s unlikely the beats will continue, but the chart below shows how much of an outlier the report is compared to history.
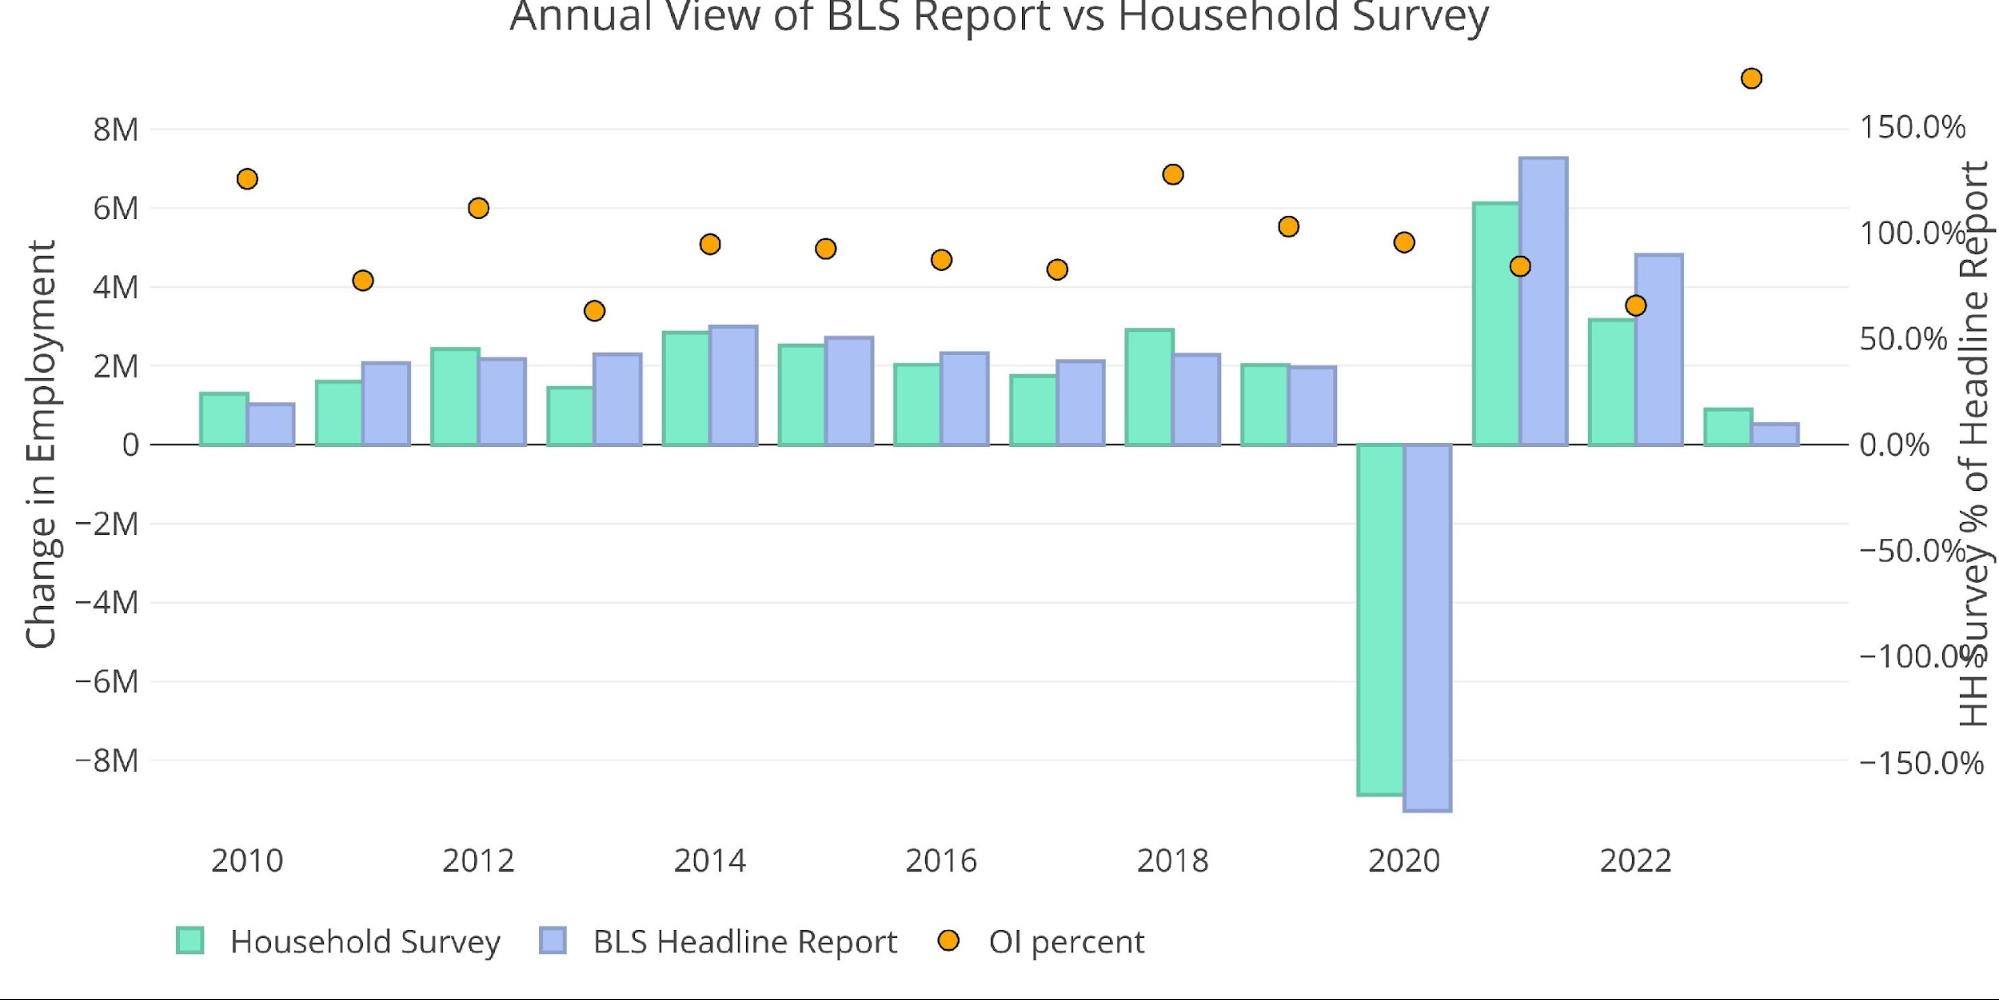
Figure: 2 Primary Report vs Household Survey – Annual
There is another report published by the BLS called the Quarterly Census of Employment and Wages (QECW). According to the BLS, this is a far more accurate and rigorous report covering 95% of jobs available at a highly detailed level. Due to the rigor, the report is released quarterly on a 7-month lag.
Unfortunately, we won’t have the January 2023 numbers until sometime in late August. The next report for Q3 2022 is set to be released later this month. It will be interesting to see if the significant underperformance in the report will continue. Currently, the 2022 QECW is 60% of the headline number. That’s a big miss! By the time summer rolls around, no one will care about this January headline number but the QECW could help explain it.
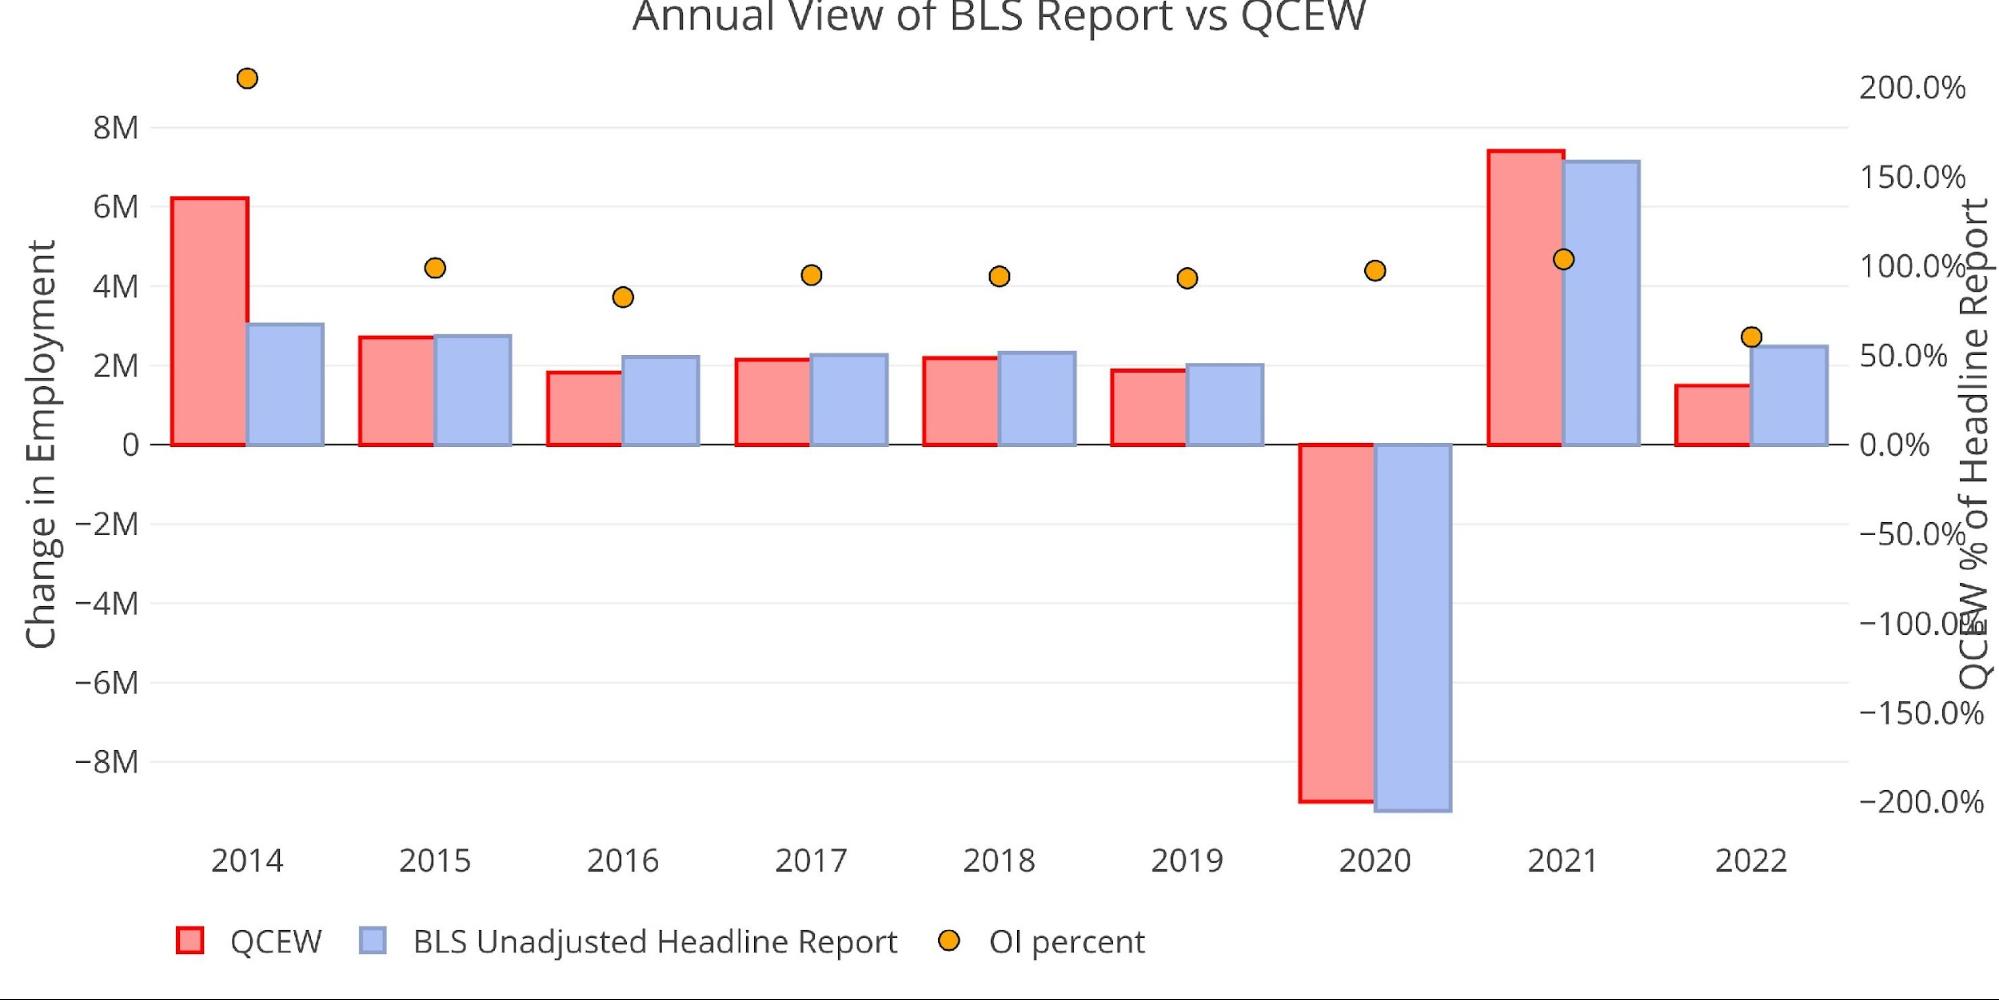
Figure: 3 Primary Report vs QCEW – Yearly
The BLS also publishes the data behind their Birth/Death assumptions. These are the jobs that the BLS assumes based on companies starting or closing. While the data is not seasonally adjusted, it directly impacts the Headline Report. The chart below shows the impact of Birth/Death jobs on the total number.
Incredibly, the Birth/Deaths were actually negative for January, which means they weighed down the report rather than helped it. This is different from last January where Birth/Deaths assumed 654k jobs were created.
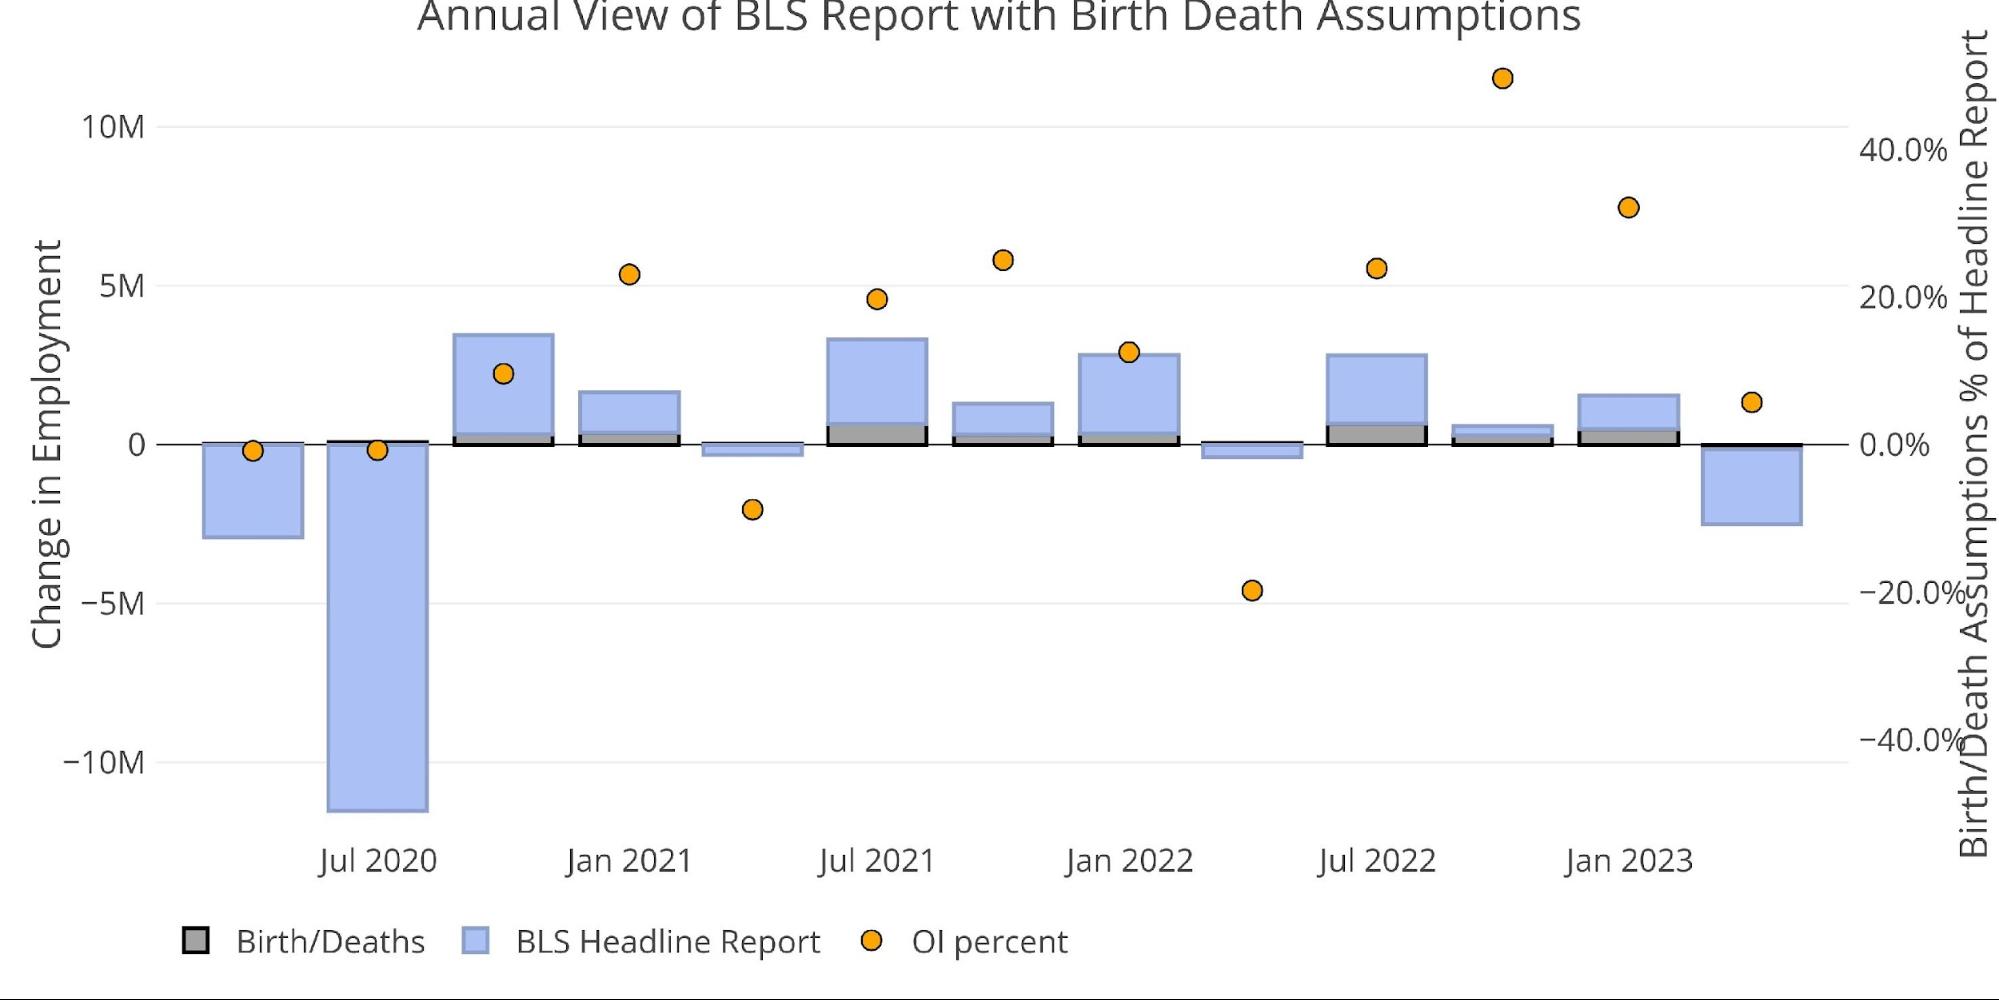
Figure: 4 Primary Unadjusted Report With Birth Death Assumptions – Quarterly
Digging Into the Report
This jobs report is the strongest since July of last year and the second strongest since last February. The unemployment rate ticked down to 3.4%
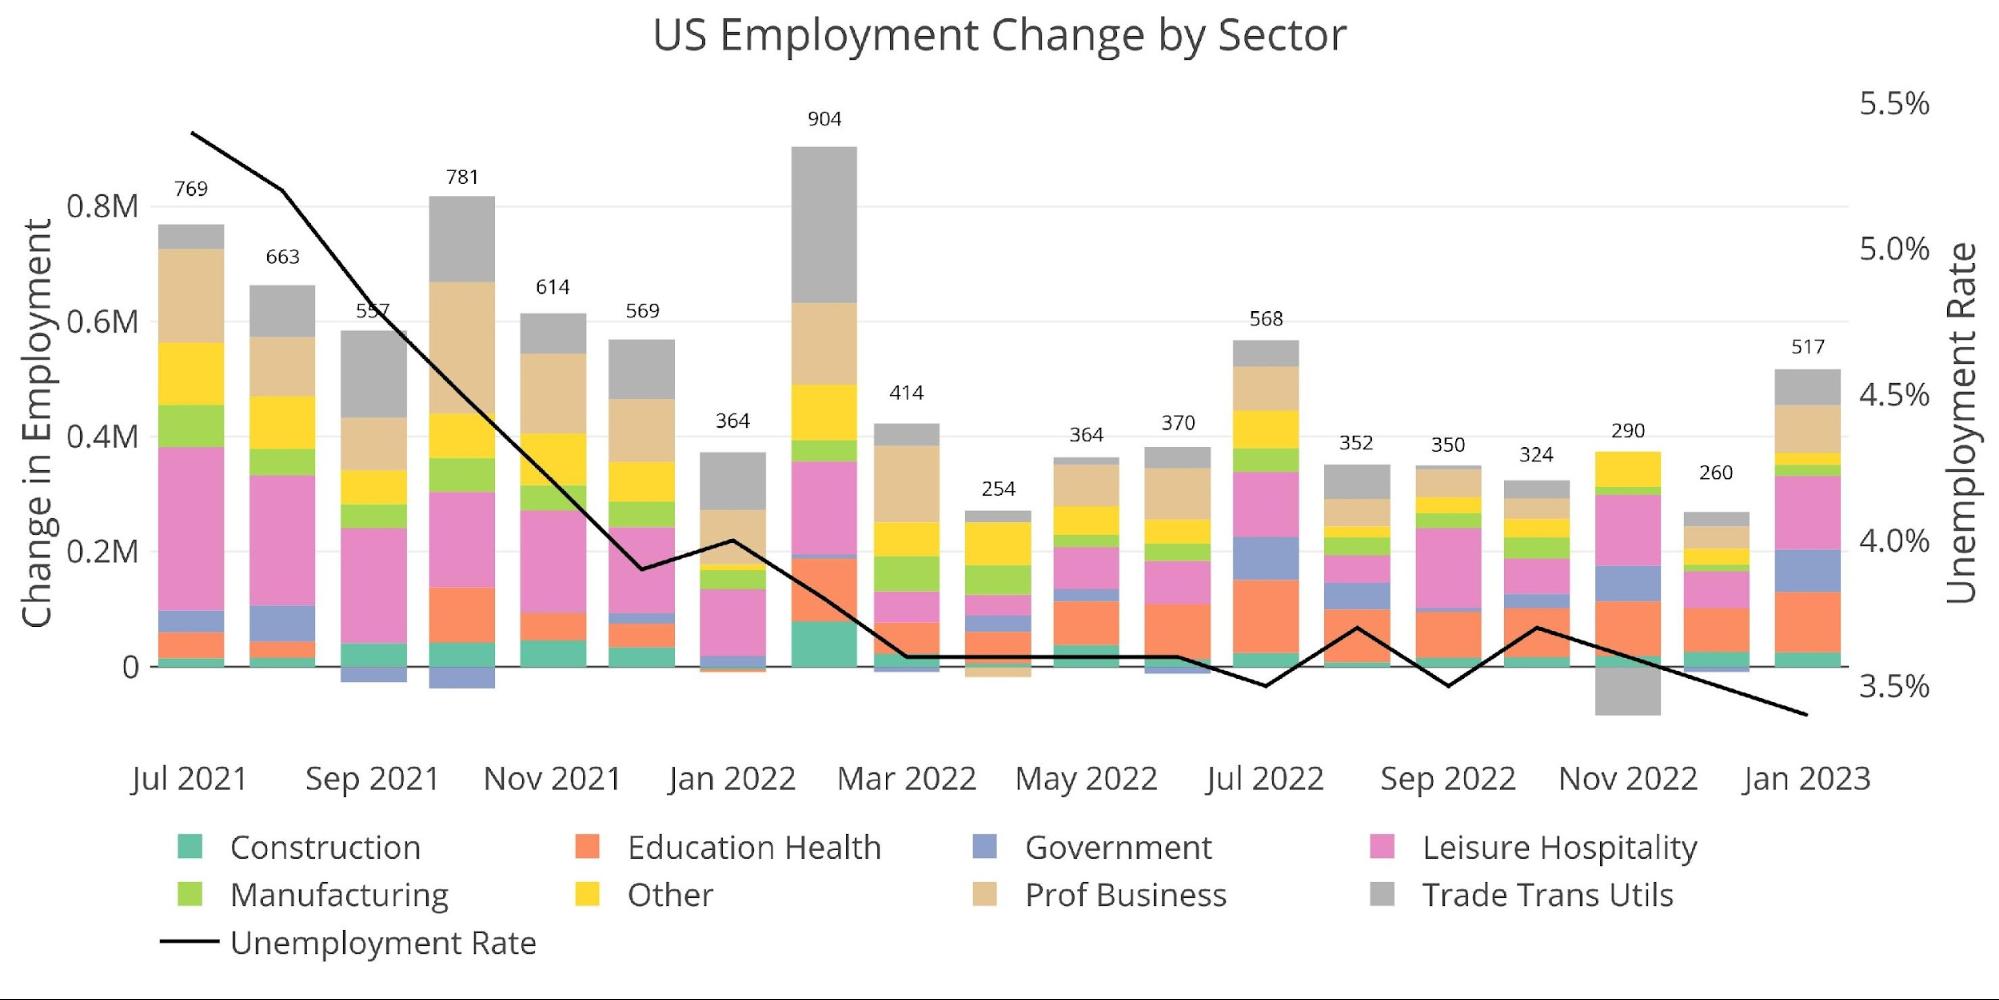
Figure: 5 Change by sector
The number of workers with multiple jobs actually fell in the latest month, down from a post-Covid peak set in December. This acts as another headwind that should have weakened the report.
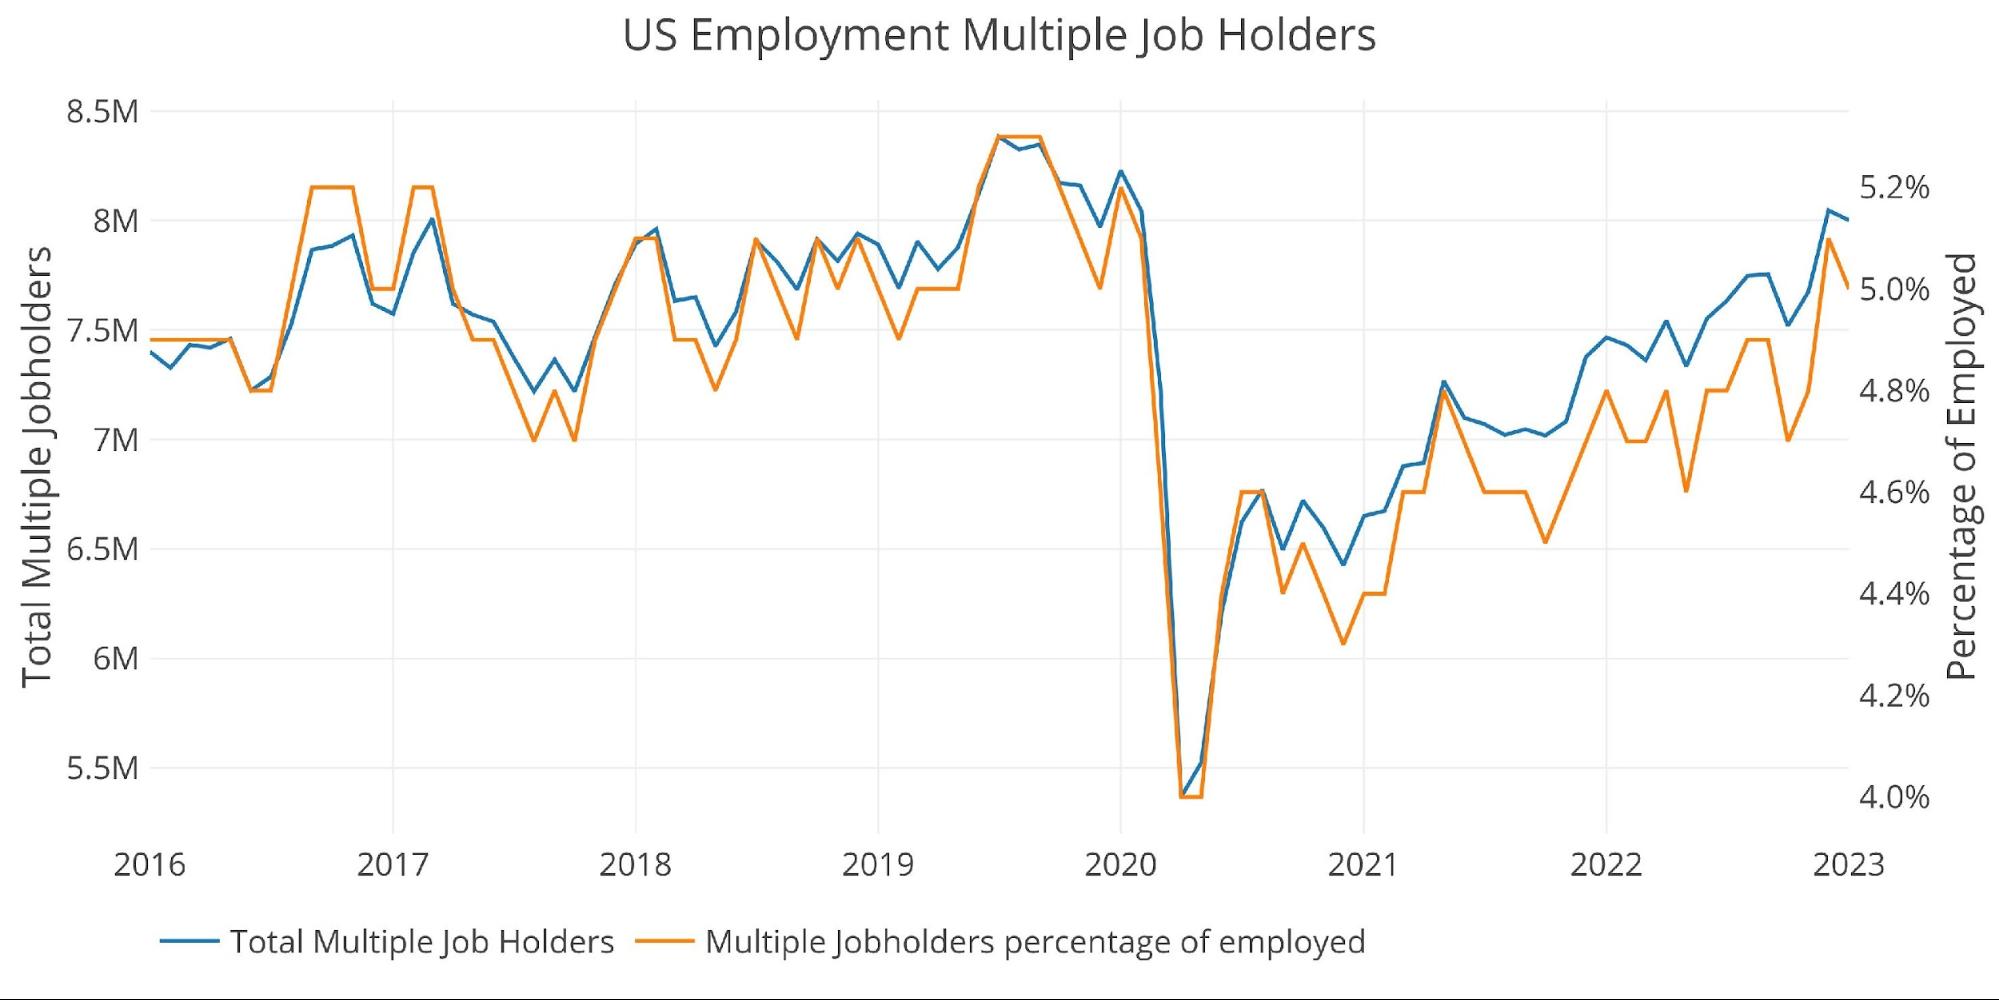
Figure: 6 Multiple Full-Time Employees
January is typically a weak month on an unadjusted basis. For example, this January, the raw number was a job loss of -2.5M. The BLS adjusts this number to smooth out the data over the year. January is typically a bad job month because all holiday workers are let go. The BLS uses models to smooth the data and account for this type of seasonality.
The adjustment up this month was 3.02M. That sounds like a big number, but is the smallest January adjustment since 2015.
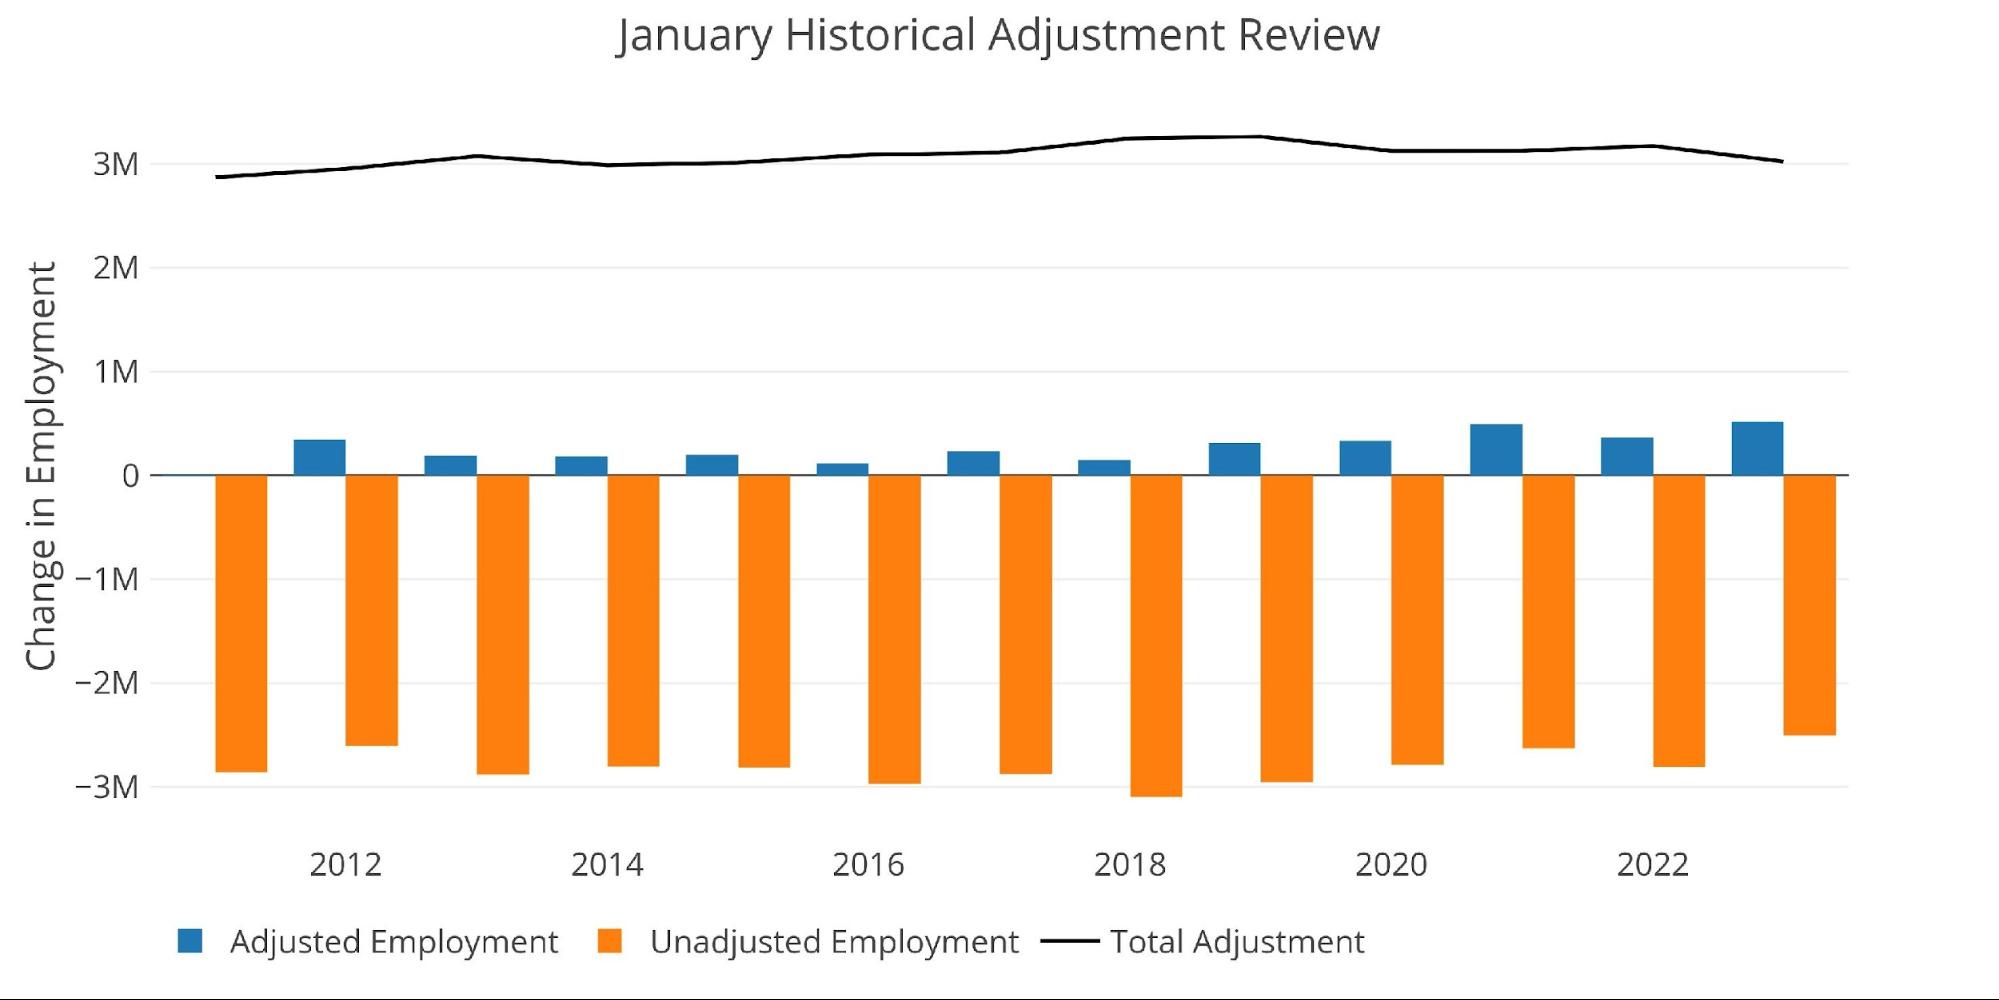
Figure: 7 YoY Adjusted vs Non-Adjusted
Breaking Down the Adjusted Numbers
6 of the 8 labor categories were above trend by a pretty wide margin. Only Manufacturing and Other are below the 12-month trend.
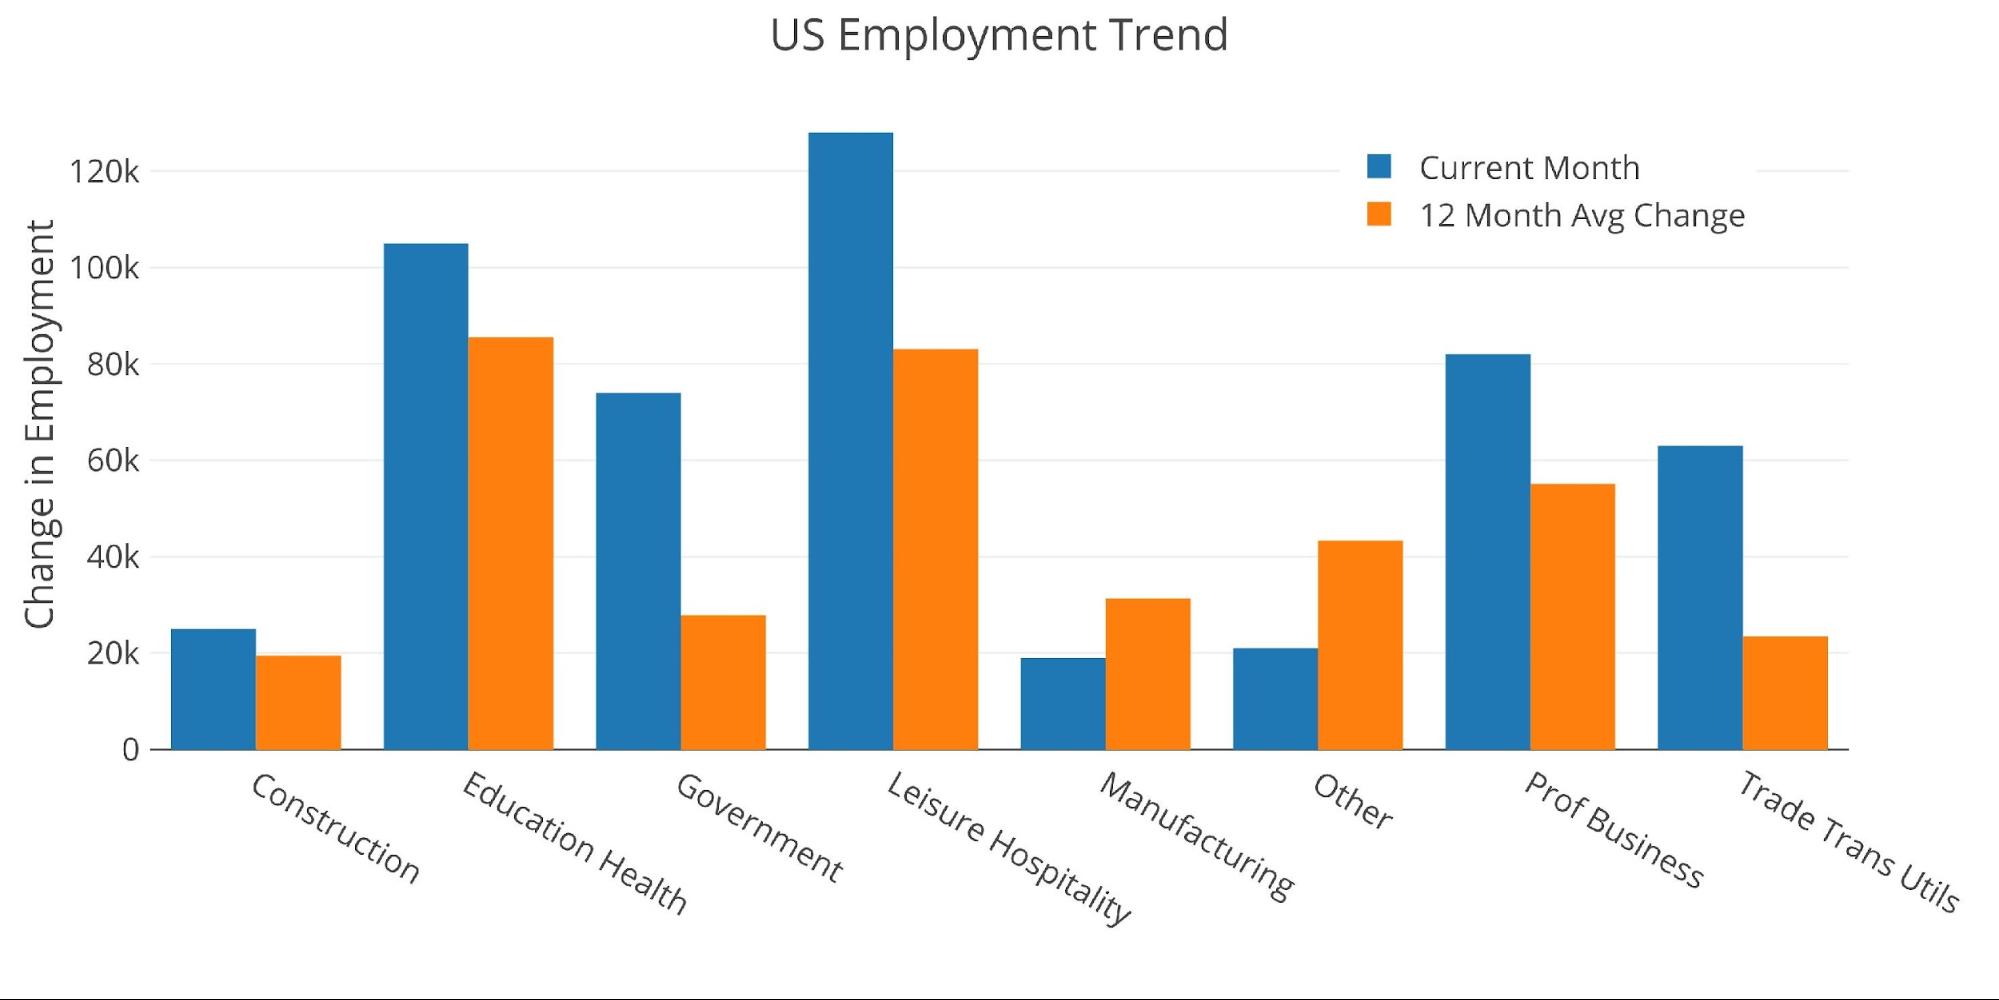
Figure: 8 Current vs TTM
The table below shows a detailed breakdown of the numbers.
Key takeaways:
-
- The current month is above the 3 and 12-month average
- The report shows that only one category (Information/Tech) saw a decline in jobs and it was very modest (-5k)
- Leisure/Hospitality and Education both saw over 100k jobs added

Figure: 9 Labor Market Detail
Revisions
While the headline number gets all the attention, the number is typically revised several times. These revisions have also been positive at 42k per month for the last three months and 16.2k for the last 12 months. This means the BLS underestimated the jobs created over the last twelve months in the initial Headline Report by almost 200k jobs.
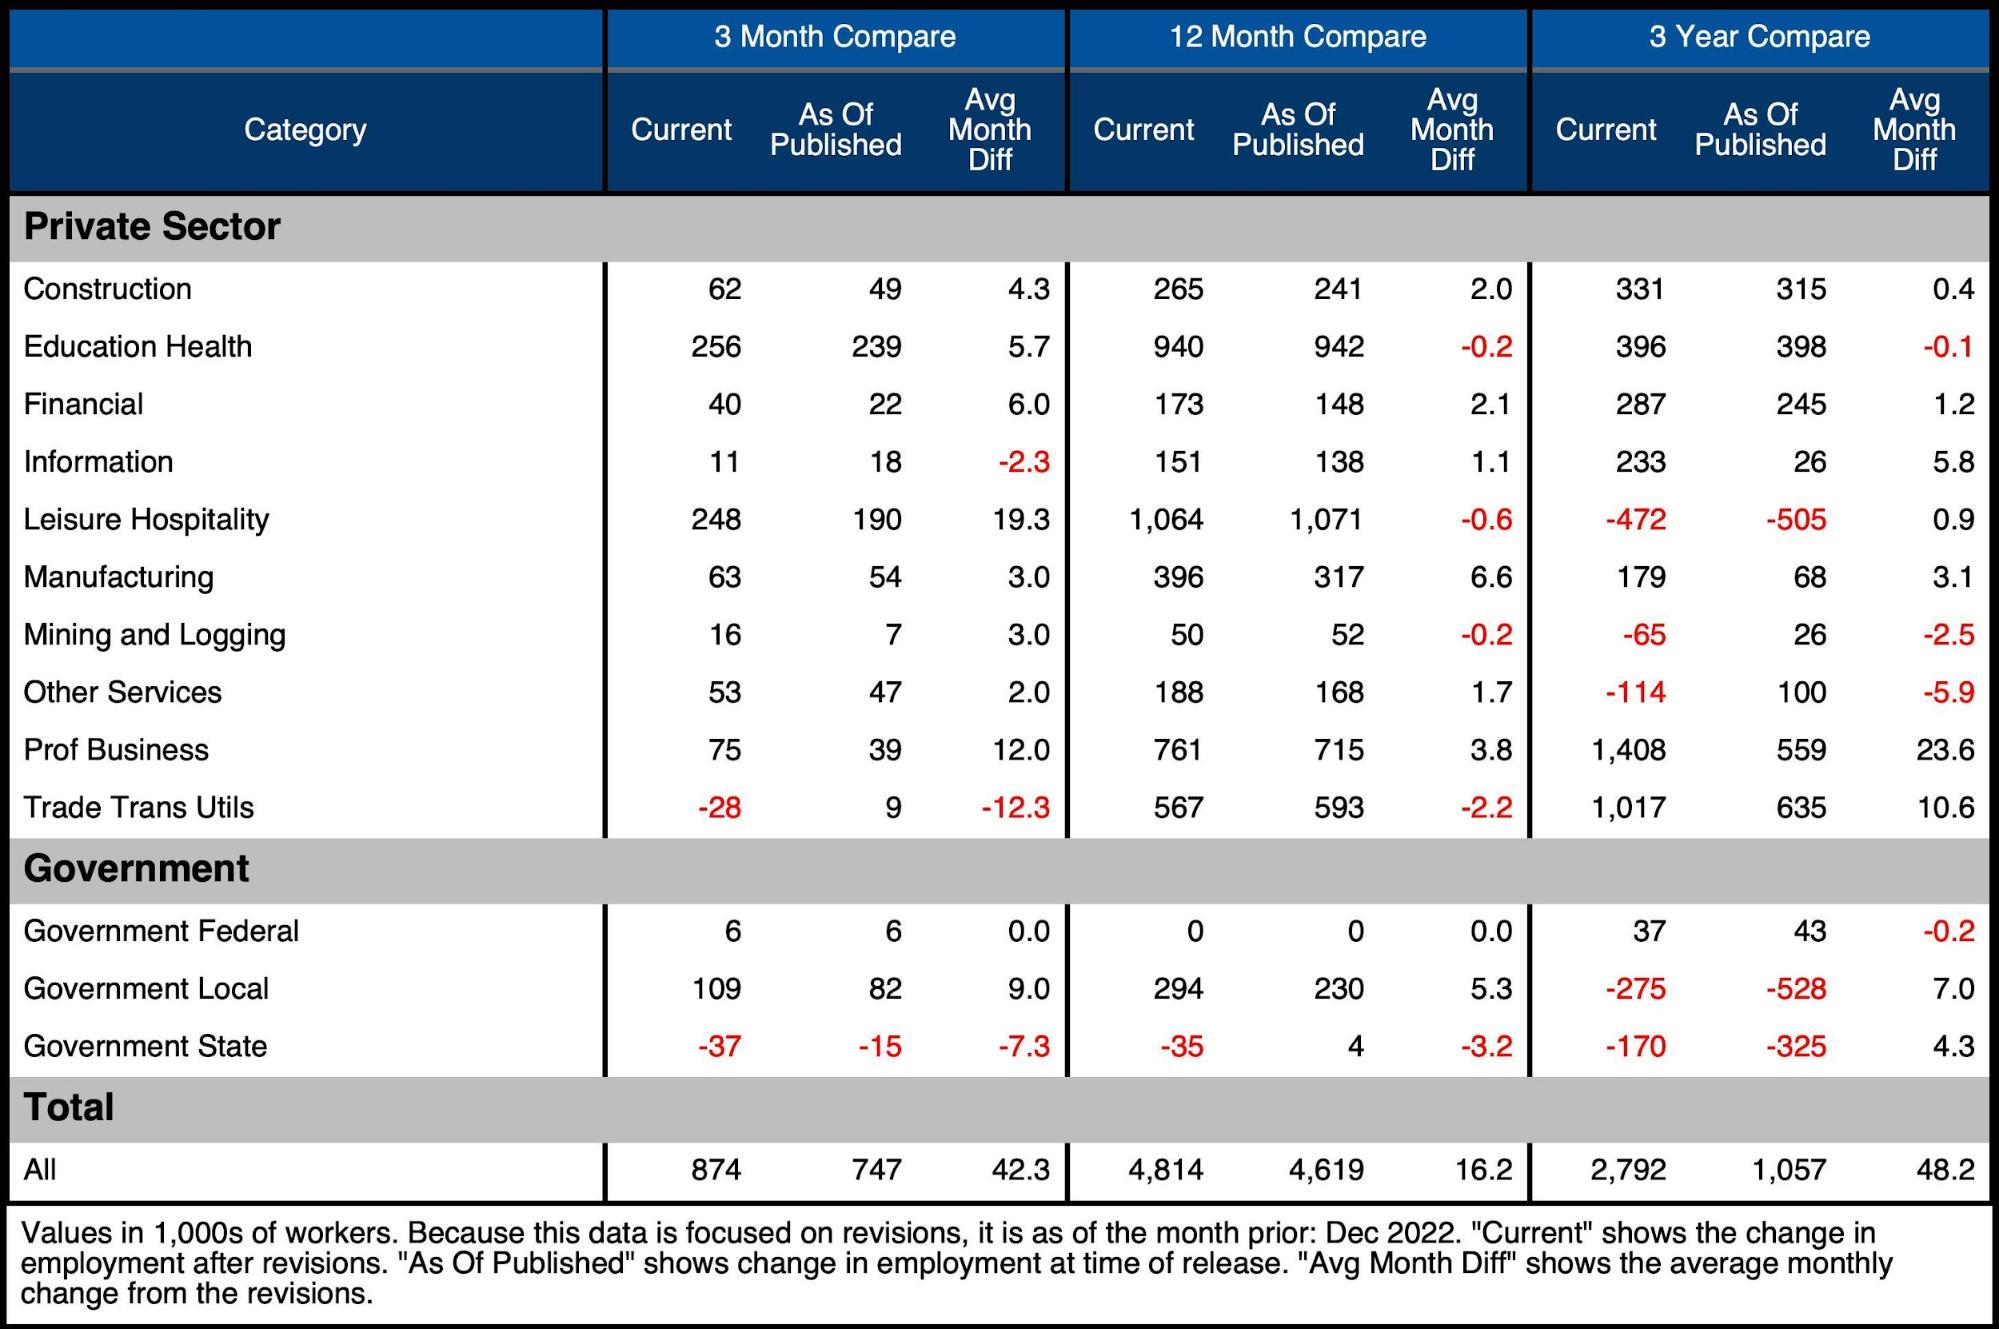
Figure: 10 Revisions
Wrapping Up
So, let’s recap really quickly:
-
- Massive beat in Headline Report
- Household Survey is even stronger than Headline
- Birth/Death assumptions actually weighed the number down
- Number of multiple job holders fell
- Revisions were positive
That is one heck of a jobs report!
Now take a step back.
These two sets of data points are not a little different. They are at polar ends of the spectrum. How can anyone look at the environment and then take such a job report seriously? This is the type of job report you would see at the height of an economic cycle where the economy is firing on all cylinders.
The BLS numbers are already hard to take at face value. Just consider how much they doctor the CPI to disguise real inflation. But this report, in the current economic environment? Come on! Something doesn’t add up.
I am a data person, and try and let data inform my decisions, but when I look at a report like this, I start to call BS on the data and go with my gut. I am not cherry-picking or trying to change the story to fit a narrative. I reported the data above as it was published by the BLS. But I am also trying to align the data with reality. My LinkedIn is blowing up with people losing their jobs and asking for help. Talented people at good companies. In some ways, this report is a slap in the face to the Americans who are struggling out there.
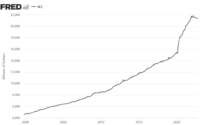
Data Source: https://fred.stlouisfed.org/series/PAYEMS and also series CIVPART
Data Updated: Monthly on first Friday of the month
Last Updated: Jan 2023
Interactive charts and graphs can always be found on the Exploring Finance dashboard: https://exploringfinance.shinyapps.io/USDebt/

Call 1-888-GOLD-160 and speak with a Precious Metals Specialist today!
[ad_2]
Source link

ECB and BOE Should Tread Carefully With Rate Hikes, IMF Says

The era of the Great Exasperation arrives for investors