The Most Splendid Housing Bubbles in America, Feb. Update: Raging Mania in Phoenix to Cooling Condos in San Francisco
But the deals were made when mortgage rates were still 3%, not 4% as today.
By Wolf Richter for WOLF STREET.
In some cities, house prices continued their crazy spikes, such as in Phoenix, where prices have exploded by over 30% year-over-year for the sixth month in a row. In other cities, prices only surged, so to speak. And in a few cities, that surge slowed. Condo prices in the San Francisco Bay Area started to dip last summer and haven’t gone anywhere since 2018. That’s the range for the most splendid housing bubbles in America, as depicted by the S&P CoreLogic Case-Shiller Home Price Index today.
The overall National Index ticked up 0.9% in December from November, same as in the prior month. Compared to a year ago, the index jumped by 18.8%, same as in the prior month. “Buyers may have been rushing in anticipation of higher rates,” S&P CoreLogic said.
But the home prices here don’t yet reflect the higher mortgage rates. Today’s “December” data are a three-month moving average of closed sales that were entered into public records in October, November, and December, reflecting deals made roughly in September, October, and November, when the average 30-year fixed mortgage rate hovered at around 3%. On Friday, the average 30-year fixed rate was 4.08%, according to Mortgage News Daily.
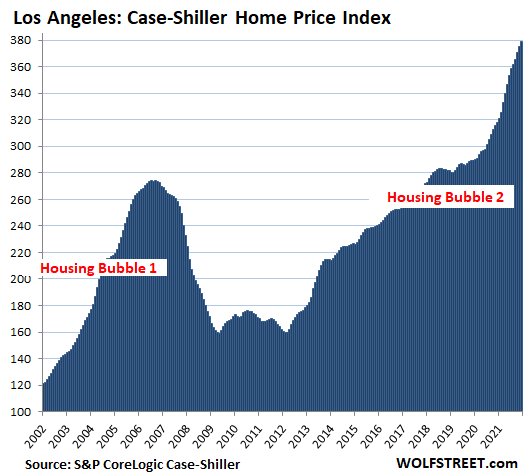
All Case-Shiller Home Price Indices were set at 100 for January 2000. The National Case-Shiller Home Price Index, with a value of 279 for “December,” indicates that national home price inflation is now 179% since 2000. Over the period, consumer price inflation, as tracked by the CPI, has risen 67%. In Los Angeles, house price inflation since 2000 has now hit 279%, over four times the rate of consumer price inflation.
Los Angeles metro: Prices of single-family houses rose 1.0% in December from November. Though steep, it was the slowest month-to-month increase since August. Year-over-year, the index jumped 19.3%. This 279% home price inflation since January 2000 makes Los Angeles the Number 1 most splendid housing bubble on this list.
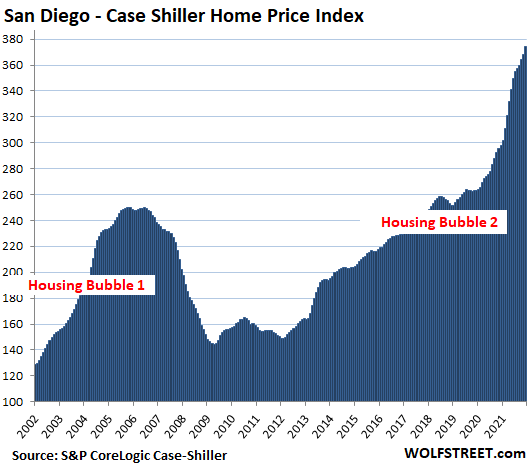
San Diego metro: The Case-Shiller Index spiked 1.8% for the month, and 29% year-over-year. Since 2000, house price inflation has ballooned by 276%:
House price inflation as measured by the Case-Shiller Index. The index’s “sales pairs method,” compares the sales price of a house when it sells in the current period to the price of the same house when it sold previously, often years earlier. The data includes adjustments for home improvements and the passage of time between sales. By measuring the price movements of the same house, the index tracks how many dollars it takes to buy the same house over time and thereby measures house price inflation.
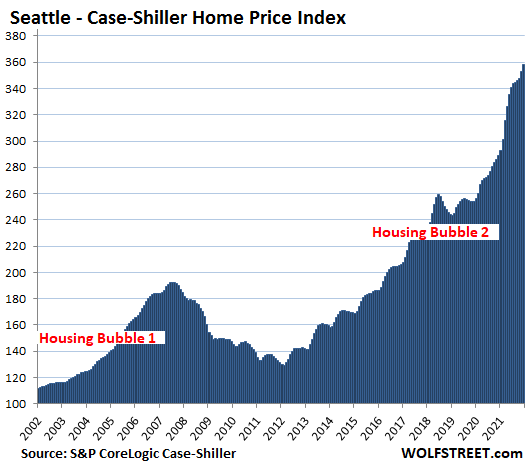
Seattle metro: House prices spiked 1.5% for the month, and 23.9% year-over-year. Since January 2000, house price inflation in the Seattle metro has ballooned to 258%:
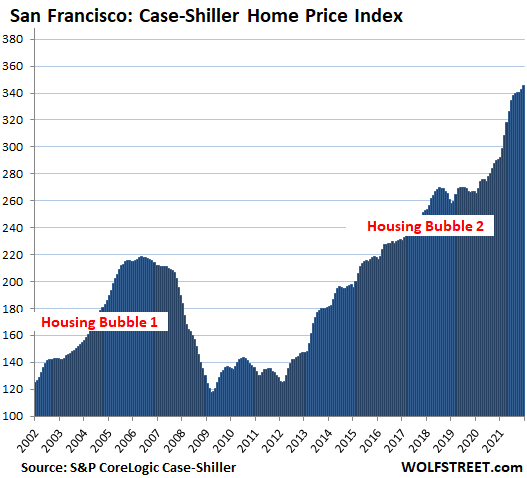
San Francisco Bay Area: House prices rose 0.8% for the month, after having nearly stalled in the fall. Year-over-year, prices jumped 18.8%:
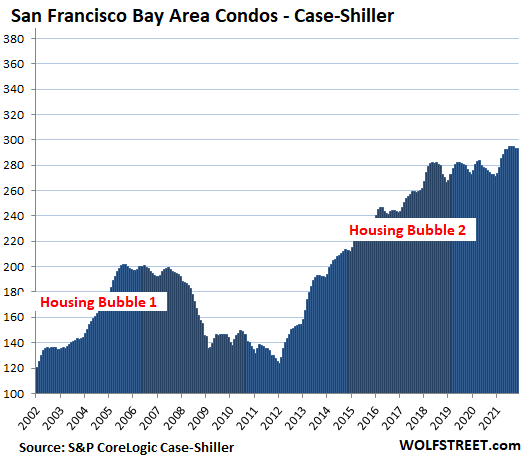
San Francisco Bay Area: Condo prices for the month were unchanged, after having dropped three months in a row. For the past seven months, prices have gone essentially nowhere. This whittled down the year-over-year gain to 7.5%. Since June 2018, condo prices have risen just 3.9%:
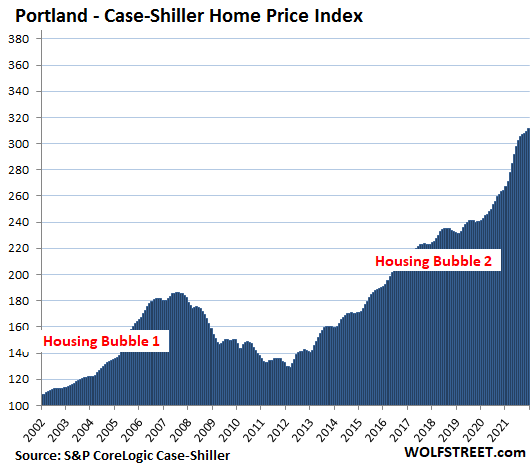
Portland metro: House prices rose by 0.8% for the month, and by 17.9% year-over-year:
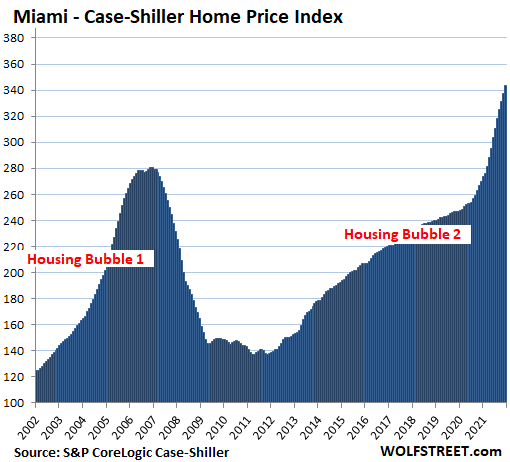
Miami metro: House prices jumped by 1.8% for the month, and by 27.3% year-over-year, the fastest since February 2006, when Miami was approaching its epic Housing Bust:
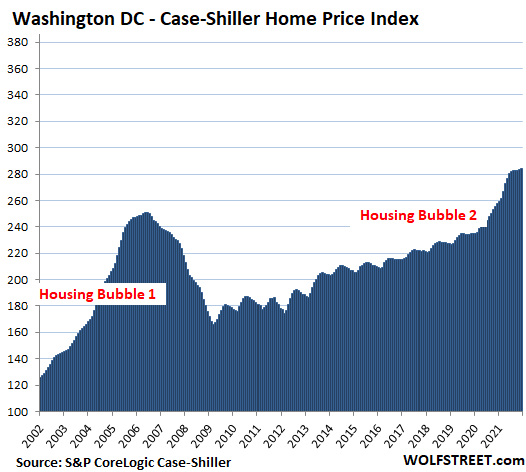
Washington D.C. metro: House prices ticked up 0.4% for the month, which whittled down the year-over-year gain to 10.5%, the slowest since January 2021:
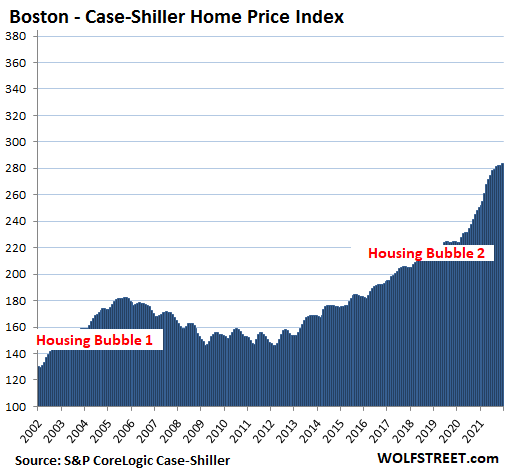
Boston metro: House prices rose 0.7% for the month, after having been flat for two months, which whittled down the year-over-year gain to 13.4%:
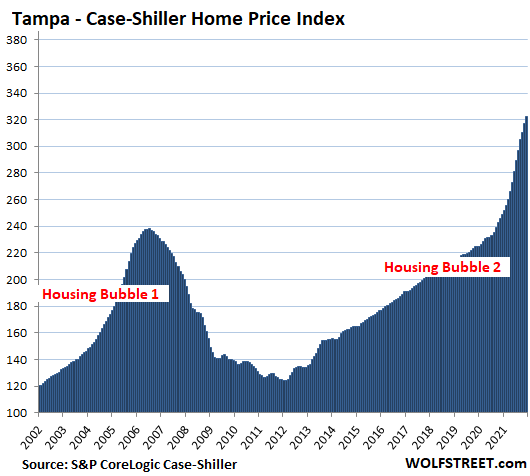
Tampa metro: +1.6% for the month, and halleluiah, +29.4% year-over-year, a new record spike for this metro, out-doing even the nutty spikes during Housing Bubble 1 before it all came apart:
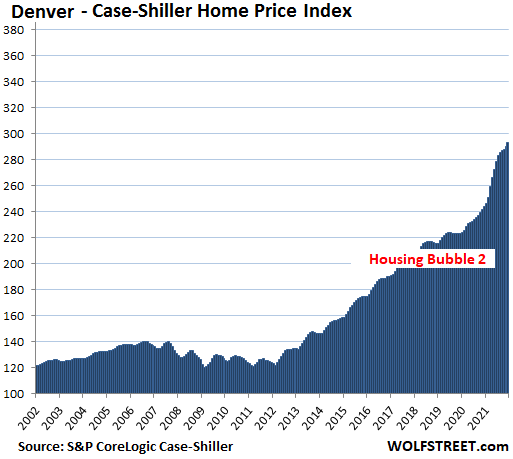
Denver metro: +1.1% for the month, and 20.3% year-over-year:
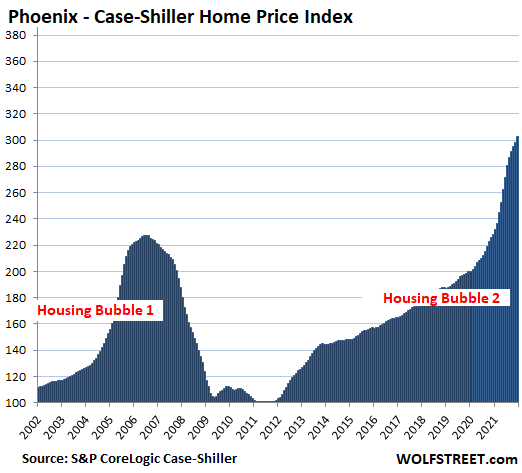
Phoenix metro: +1.3% for the month, bringing the year-over-year gain to 32.5%, a new record, out-spiking even the peak of crazy Housing Bubble 1. For months now, Phoenix has been the metro with the red-hottest year-over-year price spikes among our most splendid housing bubbles:
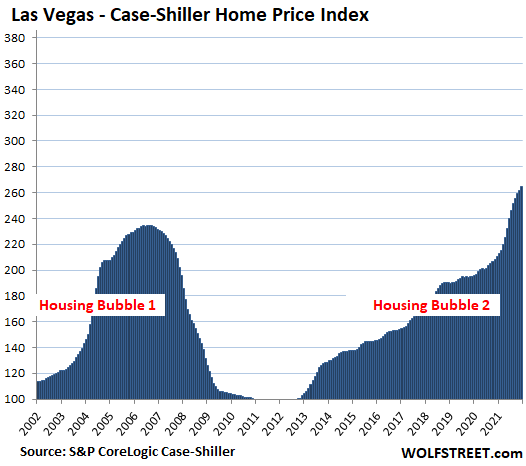
Las Vegas metro: +1.0% for the month, and +25.5% year-over-year:
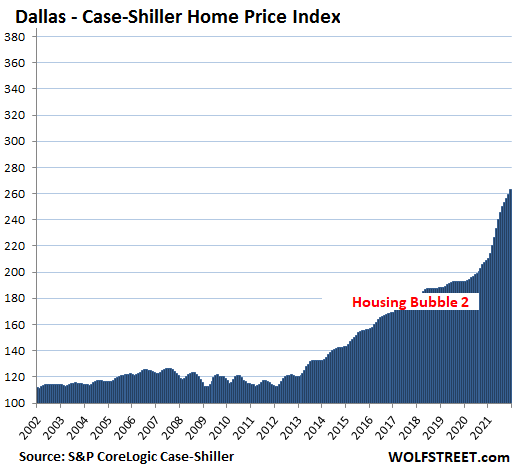
Dallas metro: +1.2% for the month, and a record +26.0% year-over-year:
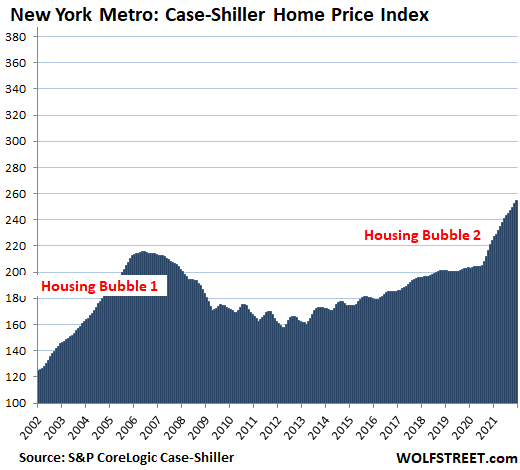
New York metro: House prices +1.1% for the month, and +13.6% year-over-year. At an index value of 255, the metro has experienced 155% house price inflation since 2000.
The remaining metros in the 20-metro Case-Shiller Index – Atlanta, Charlotte, Chicago, Cleveland, Detroit, and Minneapolis – have house price inflation since 2000 of less than 150% and thereby don’t qualify for this list of the most splendid housing bubbles.
Enjoy reading WOLF STREET and want to support it? Using ad blockers – I totally get why – but want to support the site? You can donate. I appreciate it immensely. Click on the beer and iced-tea mug to find out how:

Would you like to be notified via email when WOLF STREET publishes a new article? Sign up here.
![]()
[ad_2]
Source link

Cold War Thinking Isn’t Working

The Fed will hurt some Americans no matter what it does: Morning Brief