Ultimate No-Growth Industry: Electricity Generation in 2021 Rose to, Well, 2007 Levels, Eagerly Awaits Demand from EVs
But the mix of how power was generated changed dramatically over the years.
By Wolf Richter for WOLF STREET.
Electricity generation in the US overall has been a stagnant business since 2005 despite economic growth and despite population growth, and despite the arrival of EVs in ever larger (but still small) numbers.
There were variations from year to year based on how hot the summers were and how cold the winters, and how bad the recessions were – the Financial Crisis and the pandemic recession. But since 2005, the amount of electricity that was generated for end users has remained in the same narrow band, except in 2009, during the Financial Crisis when generation dropped below the range, as demand from the manufacturing and industrial sectors collapsed.
In 2021, the amount of electricity generated from all sources – natural gas, coal, nuclear, wind, solar, hydro, geothermal, biomass, and others – bounced back from the 2020 drop, to 4.16 million gigawatt hours, according to EIA data. This was where it had been in 2019 – and, well, in 2007!
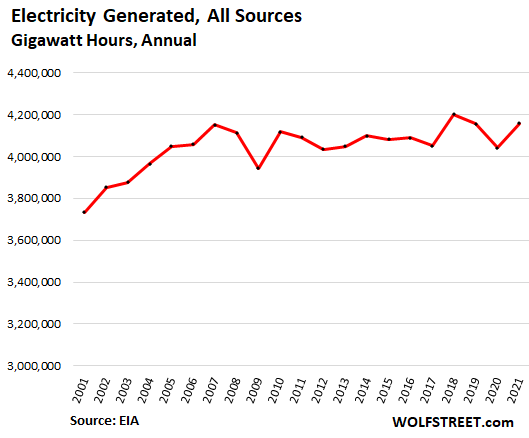
This is the no-growth business electric utilities are in, and only price increases can produce revenue growth. But this wasn’t always the case: electric utilities used to be in a steady growth business, as you can see on the left side of the chart.
The electric utility industry has been hoping for years that EVs would stimulate demand for their product (electricity).
And EVs are increasing demand a little, but at this point not enough to make up for the declining demand that resulted from investments by utility customers – residential, commercial, and industrial – in better thermal insulation and more efficient electrical equipment such as LED lights and HVAC systems. In addition, especially during the Great Recession, some manufacturing activity was offshored, and that demand for electricity never came back.
But the mix of how this electricity was generated changed dramatically.
In 2021, the price of US natural gas exploded, so to speak. In the prior years, the spot price of natural gas at the Henry Hub traded in a range between roughly $1.75 to $3.00 per million Btu. But in 2021, natural gas prices began to spike and punched through $5 per million Btu, spiking into the double-digits briefly. Even at this moment, the spot price at the Henry Hub is at $5.10.
With natural gas prices having doubled, power generators that still had coal-fired power plants started to shift some generation to their coal power plants, which caused the price of coal to shoot higher too, reducing the incentive for the shift.
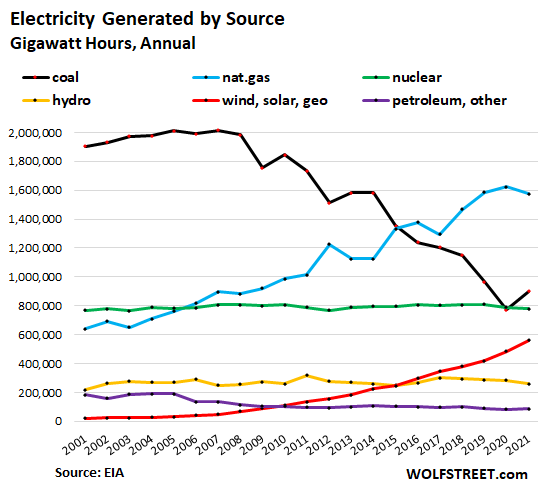
And this shift of some generation from natural gas to coal in 2021 caused power generation from natural gas (blue line in the chart below) to dip, and generation from coal (black) to rise, reversing briefly the long-term trend where generation from coal is getting replaced by generation from natural gas and other sources.
In 2021, the share of total electricity generated by:
- Natural gas (blue) = 37.9%
- Coal (black) = 21.6%
- Nuclear (green) = 18.7%
- Wind, utility-scale solar, rooftop solar, and geothermal (red) = 13.5%
- Hydro (yellow) = 6.3%
- Petroleum liquids, petroleum coke, other gases, biomass (purple) = 2.1%
The chart below shows the amount of electricity generated by source (not “capacity,” but actual electricity generated and used) over the past 20 years:
Rooftop solar, included in the red line (wind, solar, geo), accounted for 1.2% of total power generated in the US and for 30% of total solar power generated. Rooftop solar generation has been growing at about 19% year-over-year in the past three years, and between 23% and 33% year-over-year in the prior four years. In 2021, rooftop solar generated 49,000 gigawatt hours of electricity, up from 11,000 gigawatt hours in 2014.
The combined electricity generation from non-combustion renewables – hydro, wind, solar, geothermal – accounted for 19.7% of total power generation.
The share of coal collapsed from 51% in 2001 – when it was still called “king coal” – to 21.6% in 2021. In 2020, the amount of electricity generated by coal fell for the first time ever below nuclear.
The decline of coal was driven by two massive forces – technological innovation and cheap natural gas from fracking.
- Technological innovation: The combined-cycle natural-gas power plant became commercially available in the 1990s. In this type of power plant, natural gas drives a gas turbine (similar to a jet engine) that drives a generator. In addition, the exhaust heat is used to create high-pressure steam that powers a steam turbine that also drives a generator. The thermal efficiency of around 65% made this technology more cost efficient than coal.
- Cheap natural gas from fracking: the boom in fracking for natural gas in the US caused the price of natural gas to plunge by 2009.
Given these two factors – the cost efficiency of the combined-cycle natural-gas power plant and cheap natural gas from fracking – practically no new coal-fired power plants have been built over the past decade, and many of the oldest least efficient coal-fired plants have been decommissioned because they have become cost-prohibitive to operate for electric utilities.
Power generators are now hoping that EVs will boost the demand for electricity. And they will, but it will likely take a couple more years before this demand from EVs shows up in the charts here as a clear new high in electricity consumption, and we will keep an eye on it because some day in the future, it will happen. Meanwhile, the power industry and its investors are impatiently sitting on the edge of their chair, waiting for this new growth to arrive.
Enjoy reading WOLF STREET and want to support it? Using ad blockers – I totally get why – but want to support the site? You can donate. I appreciate it immensely. Click on the beer and iced-tea mug to find out how:

Would you like to be notified via email when WOLF STREET publishes a new article? Sign up here.
![]()
[ad_2]
Source link

Capitalism Doesn’t Cause Consumerism — Governments Do

Even ‘dovish’ policy assumptions require more rate hikes