WHOOSH, Dollar’s Purchasing Power Goes to Heck as Services Inflation Takes Off, Food Spikes, Energy Explodes, But Used Cars Finally Stall
The Fed is still pumping fuel on the fire.
By Wolf Richter for WOLF STREET.
The Consumer Price Index today – a measure of how fast the dollar and everything denominated in dollars, including labor, lost its purchasing power – is a horror show, the likes of which the majority of Americans have never experienced in their lives. Reality on the ground is even worse for many people because CPI is slow to pick up the red-hot housing inflation as we’ll see in a moment, and because CPI structurally is skewed to represent the inflation felt by higher-income households, while lower income households, as Fed governor Lael Brainard pointed out last week, face higher inflation and feel it much more.
The overall Consumer Price Index (CPI-U) spiked by 1.2% in March from February, and by 8.5% from a year ago, the worst since 1981, according to data released by the Bureau of Labor Statistics today.
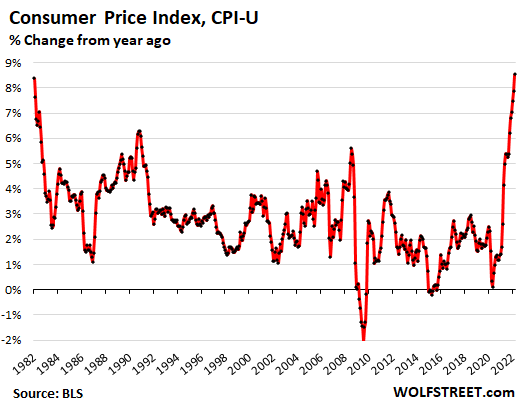
But in 1981, the Fed was effectively cracking down on inflation with double-digit policy interest rates, and inflation was on the way down.
Now inflation is spiking, and the Fed is still repressing short-term interest rates to near 0%, and it still holds $8.9 trillion in assets on its balance sheet as a result of years of money printing, including $4.8 trillion that it printed over the past two years to repress long-term interest rates and to produce the biggest wealth disparity ever. And now we’re surprised by this spike in inflation?
There is no period in history that compares to this period, not even the 1970s because the Fed wasn’t printing money in the 1970s.
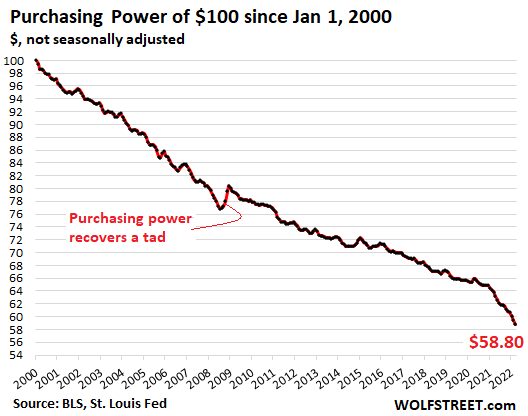
WHOOSH goes the Dollar’s Purchasing Power.
Consumer price inflation is not a sign of anything positive, but a sign of the loss of the purchasing power of the consumer’s dollar, including the purchasing power of labor. And it’s cumulative, month after month, year after year. In March, the purchasing power of $100 in January 2000 dropped to a new record low of $58.80, which explains why the mood of Americans has curdled:
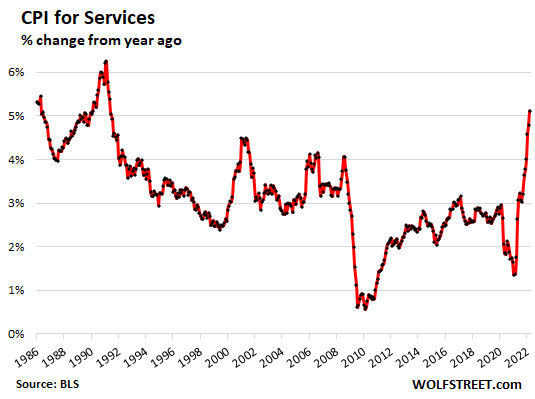
Inflation in services is now spiking.
The CPI for services – which includes housing costs – jumped by 0.7% in March from February, the third jump in a row of this magnitude, and by 5.1% compared to March last year, the worst services inflation since 1991. Given how slow the CPI is in picking up the surging housing costs, this portion of the CPI will continue to get worse, even as prices of gasoline and used cars might come down some.
Inflation in housing costs.
The largest component in CPI is “shelter,” a basket of services that is designed to represent housing costs and accounts for 32.7% of total CPI. The largest components in this basket are “Rent of primary residence,” accounting for 7.3% of total CPI, and “Owner’s equivalent rent of residence,” accounting for 24.0% of total CPI.
“Rent of primary residence” jumped by 4.4% in March (red in the chart below). This tracks what tenants reported as their actual rent payments, including in rent-controlled apartments.
“Owner’s equivalent rent of residences” rose 4.5% (green line). This tracks the costs of homeownership as a service, based on what homeowners reported that their home would rent for.
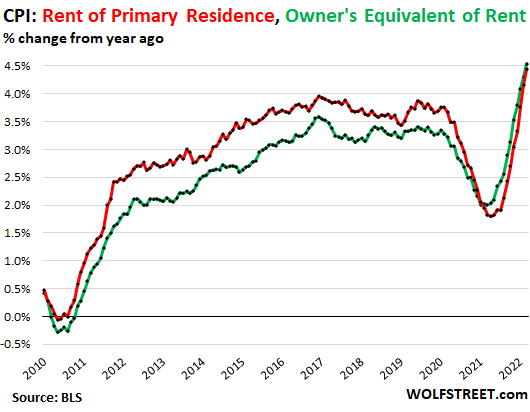
Because both of these rent measures are lagging, they will continue to spike as they catch up, even if over the next 12 months housing inflation actually were to cool down a little. So these housing components that weigh much more heavily than used cars or gasoline are guaranteed to provide upward pressure on CPI well into 2023 (my discussion of this phenomenon).
Note that both measures are still well below the overall CPI and therefor are still holding down CPI, but less than before, and as they rise, they will hold down CPI even less.
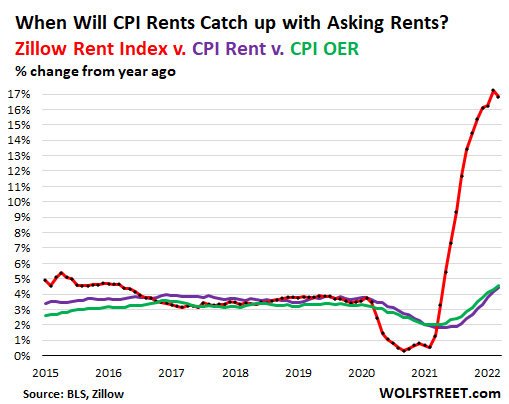
In terms of “asking rents” across the US, which is a measure of what landlords are asking for their apartments and houses that they have listed for rent, the inflation picture is red hot. The Zillow Rent Index has shot up 16.8% year-over-year, despite the slight dip in March. Compare to it the “rent of primary residence” (purple) and the “owner’s equivalent rent” (green), which have a lot of catching up to do, and they will catch up partially, but with a lag:
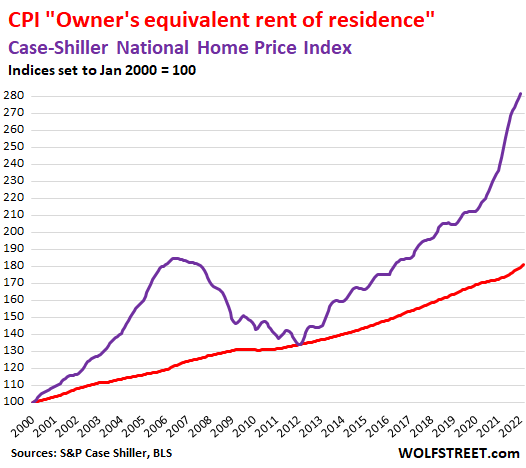
The actual costs of purchasing a house spiked by 19.2% year-over-year, according to the Case-Shiller Home Price Index, with totally crazy raging mania in some markets, depicted in The Most Splendid Housing Bubbles in America.
The CPI however hasn’t picked up that raging mania in housing costs as you can see in this chart of the National Case-Shiller index (purple) and the CPI for “owner’s equivalent or rent,” the stand-in for homeownership costs (red). Both indices are set to 100 for January 2000. The chart shows the disconnect of housing costs in CPI and the reality homebuyers are facing:
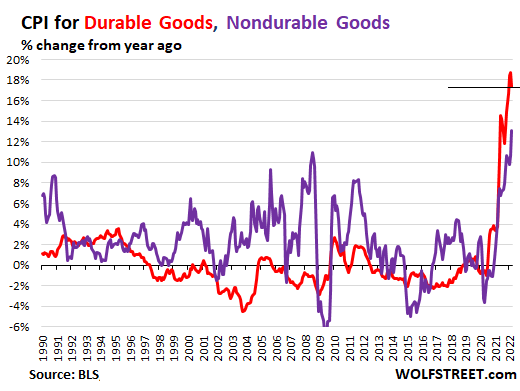
Inflation in durable goods v. nondurable goods.
The durable goods CPI – includes new and used vehicles, consumer electronics, furniture, appliances etc. – spiked by 17.4% year-over-year, the third-worst ever behind January and February. On a month-to-month basis, it backed off for the first time in months (red in the chart below).
The down-tick was due to CPI used vehicles, which fell for the second month in a row (-3.8% in March from February), which whittled down the year-over-year spike to a still crazy 35.3%. That used vehicles hit price resistance, on slowing volume and plenty of supply, became clear months ago (my discussion on this ultimately ridiculous historic spike and its decline).
The CPI for new vehicles ticked up just a tad in March from February, and year-over-year was up 12.5%, the second worst ever, behind the 12.7% spike in 1975.
The CPI for nondurable goods – which is dominated by food, energy, and household supplies – spiked by 13.1%, the worst since 1980 (purple line):
“Food at home” inflation spiked by 1.0% for the month and by 8.5% year-over-year. Major categories, and their year-over-year spikes in CPI inflation rates:
- Cereals and cereal products: 10.1%
- Beef and veal: 16.0%
- Pork: 15.3% as folks switched to pork from beef.
- Poultry: 13.2% as folks switched to poultry from pork.
- Fish and seafood: 10.9%
- Eggs: 11.2%
- Fresh fruits: 10.1%
- Fresh vegetables: 5.9%
- Dairy and related products: 7.0%
- Coffee: 11.2%
- Fats and oils: 14.9%
- Baby food: 10.8%
“Food away from home” inflation jumped by 6.9% year-over-year, the most since 1982. This includes everything from high-end restaurants to food at elementary schools.
Energy costs exploded by 11.0% for the month and by 32.0% year-over-year. They weigh 7.6% of overall CPI. Among them:
- Gasoline: +18.3% for the month and +48.0% year-over-year.
- Utility natural gas to the home: +0.6% for the month and +21.6% year-over-year.
- Electricity service: +2.2% for the month, +11.1% year-over-year.
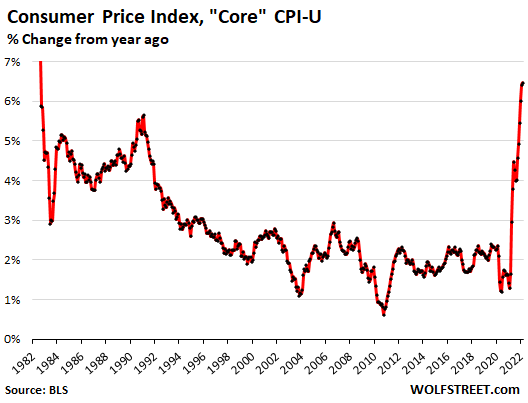
Core CPI: Inflation if you don’t buy food and energy.
The “core” CPI-U excludes the volatile commodities-dependent food and energy components in order to measure inflation in the broader economy. Thanks to the month-to-month decline in the CPI for durable goods, and the slowness with which housing inflation is getting picked up, the core CPI rose “only” 0.3% for the month and by 6.5% year-over-year, the worst spike since 1982.
Dear crypto fans, we love you, but…
Have fun with cryptos and gambling with cryptos, make big money, lose big money. But don’t claim that they’re a hedge against inflation or against the collapse of the dollar or whatever, because Bitcoin has plunged by 33% against the dollar year-over-year, and by 41% against the dollar from the peak in November. Plus, on top of it, Bitcoin lost another 8.5% in purchasing power due to inflation. So do the math, in terms of this being a hedge against anything.
Enjoy reading WOLF STREET and want to support it? Using ad blockers – I totally get why – but want to support the site? You can donate. I appreciate it immensely. Click on the beer and iced-tea mug to find out how:

Would you like to be notified via email when WOLF STREET publishes a new article? Sign up here.
![]()
[ad_2]
Source link

Goldman, UBS take opposite stands on gold after worst week since November (NYSEARCA:GLD)