April Payrolls Rise More Than Expected But Wage Growth Slows And Participation Rate Drops
With bulls hoping and praying for a terrible payrolls print – ideally something in the mins 1 million range – and for a big slowdown in wage growth, moments ago the BLS reported a mixed bag for April data, with headline payrolls rising 428K, above the 380K expected (which is in the “good news is bad news” camp), however at the same time average hourly earnings rose 0.3%, below the 0.4% expected (and 0.5% March increase) while the unemployment rate was flat at 3.6%, above the 3.5% expected (both of which are “bad news is good news”).
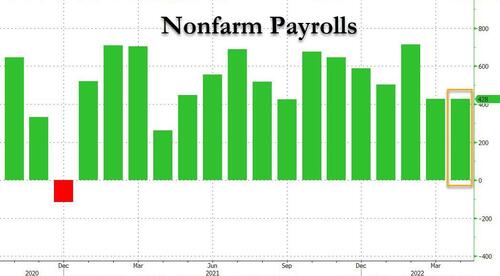
Amusingly, the March payroll print was downward revised to 428K from 431K, the exact same as the March print. Looking further back, the change in total nonfarm payroll employment for February was revised down by 36,000, from +750,000 to +714,000, and the change for March was revised down by 3,000, from +431,000 to +428,000. With these revisions, employment in February and March combined is 39,000 lower than previously reported.
Total payrolls are now about 1.2 million lower than the peak hit before the pandemic. At the April hiring pace, that gap will be made up by July.
The unemployment rate was flat at 3.6%, above consensus expectations of a drop to 3.5%.
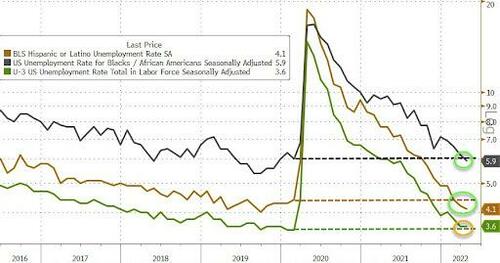
Among the major worker groups, the unemployment rates for adult men (3.5 percent), adult women (3.2 percent), teenagers (10.2 percent), Whites (3.2 percent), Blacks (5.9 percent), Asians (3.1 percent), and Hispanics (4.1 percent) showed little or no change over the month. It is worth noting that the overall unemployment rate is at pre-covid levels, while the rate for blacks and hispanics is now even better than pre-covid.
Curiously, even as the unemployment rate was flat, the labor force participation rate actually declined from 62.4% to 62.2%, a move that will disappoint the Fed which has been pushing for an “inclusive” boost to the labor force. The drop was due to a 363K drop in the civilian labor force offset by a 115K increase in the civilian population.
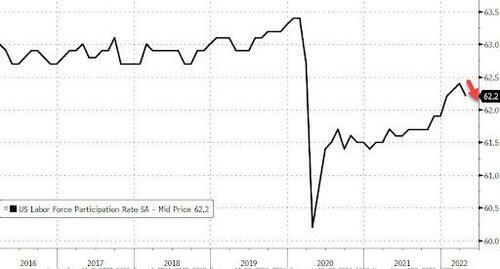
According to Bloomberg, the big decline in labor force participation was centered among people ages 16-24. There’s typically more focus on the prime-age group (25-54) which many people consider working age.
Broken down by gender, there was a light gap in trends for women and men. The jobless rate for women 20 and over actually did drop, to 3.2% last month from 3.3% the previous month. Unemployment among men 20 and over ticked up to 3.5% from 3.4%.
Looking at wages, average hourly earnings for all employees on private nonfarm payrolls rose by 10 cents, or 0.3 percent, to $31.85 in April, below the 0.4% expected. Here is a breakdown of the 0.3% by industry:
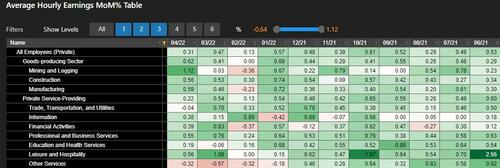
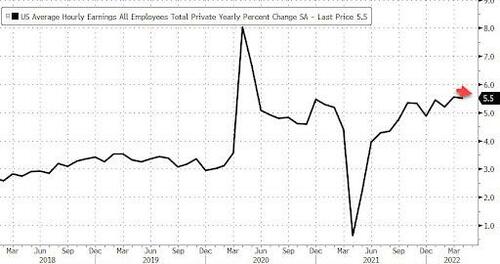
Over the past 12 months, average hourly earnings have increased by 5.5 percent, in line with expectations.
Ian Shepherdson, chief economist at Pantheon Macroeconomics, said he is seeing a trend in the softness of average hourly earnings:
“The modest 0.3% increase in AHE is a surprise to us, because a calendar quirk signaled risk of a bigger increase. The relative softness has now persisted for three months, and it’s starting to look like a trend. The three-month annualized rate of increase of AHE now stands at just 3.7%, the lowest since March 2021, and down sharply from 6.3% as recently as November last year. The rising trend in participation appears to be facilitating a moderation in wage growth, but nothing is certain until the mix-adjusted quarterly ECI data tell the same story.”
The average workweek for all employees on private nonfarm payrolls was unchanged at 34.6 hours in April, below the 34.7 expected. In manufacturing, the average workweek for all employees fell by 0.2 hour to 40.5 hours, and overtime held at 3.4 hours. The average workweek for production and nonsupervisory employees on private nonfarm payrolls was unchanged at 34.1 hours.
Some more details from the Household Survey:
- The number of persons employed part time for economic reasons was little changed at 4.0million in April and is down by 357,000 from its February 2020 level. These individuals, who would have preferred full-time employment, were working part time because their hours had been reduced or they were unable to find full-time jobs.
- The number of persons not in the labor force who currently want a job was little changed at 5.9 million in April. This measure is above its February 2020 level of 5.0 million. These individuals were not counted as unemployed because they were not actively looking for work during the 4 weeks preceding the survey or were unavailable to take a job.
- Among those not in the labor force who wanted a job, the number of persons marginally attached to the labor force increased by 262,000 in April to 1.6 million. These individuals wanted and were available for work and had looked for a job sometime in the prior 12 months but had not looked for work in the 4 weeks preceding the survey. Discouraged workers, a subset of the marginally attached who believed that no jobs were available for them, numbered 456,000 in April, little different from the prior month.
- In April, 7.7 percent of employed persons teleworked because of the coronavirus pandemic, down from 10.0 percent in the prior month. These data refer to employed persons who teleworked or worked at home for pay at some point in the 4 weeks preceding the survey specifically because of the pandemic.
- In April, 1.7 million persons reported that they had been unable to work because their employer closed or lost business due to the pandemic–that is, they did not work at all or worked fewer hours at some point in the 4 weeks preceding the survey due to the pandemic. This measure is down from 2.5 million in the previous month. Among those who reported in April that they were unable to work because of pandemic-related closures or lost business, 19.0 percent received at least some pay from their employer for the hours not worked, little different from the prior month.
- Among those not in the labor force in April, 586,000 persons were prevented from looking for work due to the pandemic, down from 874,000 in the prior month.
Turning to the Establishment survey, we find the following:
- Employment in leisure and hospitality increased by 78,000 in April. Job growth continued in food services and drinking places (+44,000) and accommodation (+22,000). Employment in leisure and hospitality is down by 1.4 million, or 8.5 percent, since February 2020.
- Manufacturing added 55,000 jobs in April. Employment in durable goods rose by 31,000, with gains in transportation equipment (+14,000) and machinery (+7,000). Nondurable goods added 24,000 jobs, with job growth in food manufacturing (+8,000) and plastics and rubber products (+6,000). Since February 2020, manufacturing employment is down by 56,000, or 0.4 percent.
- Employment in transportation and warehousing rose by 52,000 in April. Within the industry, job gains occurred in warehousing and storage (+17,000), couriers and messengers (+15,000), truck transportation (+13,000), and air transportation (+4,000). Employment in transportation and warehousing is 674,000 above its February 2020 level, led by strong growth in warehousing and storage (+467,000) and in couriers and messengers (+259,000).
- In April, employment in professional and business services continued to trend up (+41,000). Since February 2020, employment in the industry is up by 738,000.
- Financial activities added 35,000 jobs in April, led by a gain in insurance carriers and related activities (+20,000). Employment also rose in nondepository credit intermediation (+6,000) and in securities, commodity contracts, and investments (+5,000). Employment in financial activities is 71,000 higher than in February 2020.
- Health care employment rose by 34,000 in April, reflecting a gain in ambulatory health care services (+28,000). Employment in health care is down by 250,000, or 1.5 percent, since February 2020.
- Employment in retail trade increased by 29,000 in April. Job gains in food and beverage stores (+24,000) and general merchandise stores (+12,000) were partially offset by losses in building material and garden supply stores (-16,000) and health and personal care stores (-9,000). Retail trade employment is 284,000 above its level in February 2020.
- In April, wholesale trade employment rose by 22,000. Employment in the industry is down by 57,000, or 1.0 percent, since February 2020.
- Mining added 9,000 jobs in April, with a gain in oil and gas extraction (+5,000). Mining employment is 73,000 higher than a recent low in February 2021.
- Employment showed little change over the month in other major industries, including construction, information, other services, and government.
And visually:
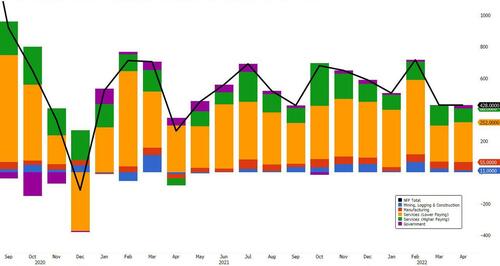
Sources of strength in the print was employment in leisure and hospitality increased by 78,000 in April. Manufacturing added 55,000 jobs — much more than expected. Employment in transportation and warehousing rose by 52,000 in April.
Commenting on the report, Randy Kroszner, economics professor at the University of Chicago Booth School of Business and former Fed governor, tells Bloomberg TV that lots of people are still unsure of entering the labor force. “That’s going to be a continuing constraint on growth because you’re just not going to see as much labor force participation and that’s going to continue wage pressure.”
Principal Global Investors’ Chief Strategist Seema Shah says it’s hard to come up with takeaways from the report.
“After yesterday’s selloff, the market needed some type of good news to settle nerves. Yet is solid employment data good news or bad news?” she asks.
“Today’s firm payroll data is good in that it confirms that the labor market is strong and suggests the U.S. economy may be sufficiently resilient to deal with the forthcoming monetary tightening, but bad in that it likely implies the Fed needs to do some seriously heavy lifting in order to slow activity down and subdue price pressures.”
Overall, the April print was “goldilocks”, with modest upside strength in the headline print offset by modest wage growth weakness. Then again, at 5.5% annually, it will take a much bigger economic hit to reverse the wage-price spiral and judging by the market reaction which saw 10Y yields initially dip only to spike back over 3.10%, the Fed has a lot more selling to do before wages stabilize back in the 2-3% range.
[ad_2]
Source link
Time to load up on goldl? This indicator says gold prices could surge 30%