Housing Bubble Getting Ready to Pop: Unsold Inventory of New Houses Spikes by Most Ever, to Highest since 2008, with 9 Months’ Supply, Sales Collapse at Prices below $400k
Stocks of homebuilders swoon amid worst inflation in construction costs, shortages, and spiking mortgage rates that take buyers out of the market.
By Wolf Richter for WOLF STREET.
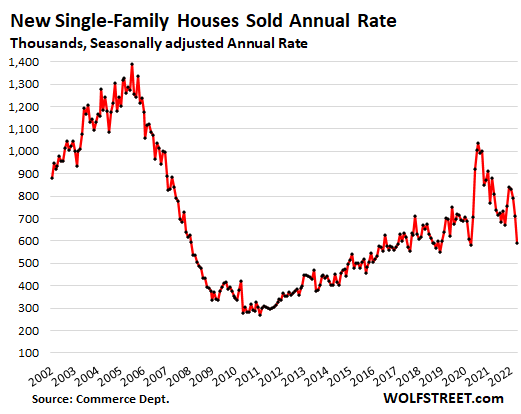
Sales of new single-family houses in April plunged by 16.6% from March and by 26.9% from a year ago, to a seasonally adjusted annual rate of 591,000 houses, the lowest since lockdown April 2020, according to the Census Bureau today. Sales of new houses are registered when contracts are signed, not when deals close, and can serve as an early indicator of the overall housing market.
By region, sales plunged the most in the South:
- South: -19.8% for the month, -36.6% year-over-year.
- Midwest: -15.1% for the month, -25.5% year-over-year
- West: -13.8% for the month, -12.4% year-over-year.
- Northeast: -5.9% for the month, +17.1% year-over-year
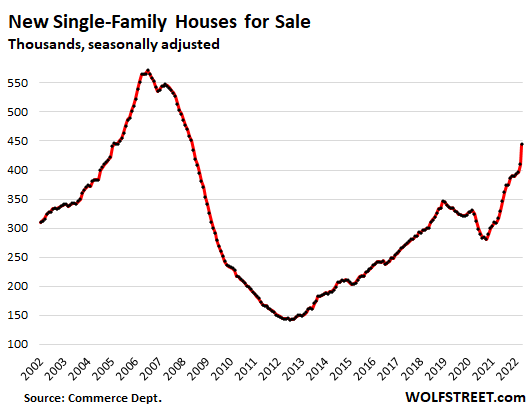
Unsold inventory of new houses spiked in a historic month-to-month leap of 34,000 houses, and by 127,000 houses from April last year, to 444,000 unsold houses, seasonally adjusted, the highest since May 2008.
Both, the month-to-month leap and the year-over-year leap were the largest leaps ever recorded, both in numbers of unsold houses and in percentages.
By region, unsold inventory spiked the most in the South, and dipped in the Northeast. Percent increase year-over-year:
- South: +53%
- Midwest: +39%
- West: +8.4%
- Northeast: -4%
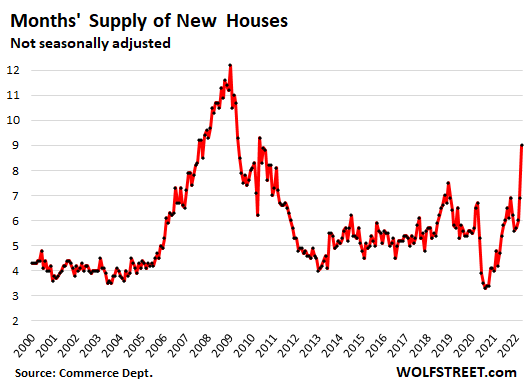
Supply of unsold new houses spiked in a historic month-to-month leap from an already high 6.9 months’ supply in March to a dizzying 9.0 months’ supply in April, having nearly doubled from a year ago:
The bottom fell out under $400,000. At the top end, things weren’t so bad: sales were flat year-over-year in the $400,000 to $750,000 range, though they fell on a month-to-month basis. But you cannot maintain a housing market by just selling to the wealthy.
In the price categories below $400,000, the bottom fell out. The drop in sales year-over-year:
- $300k to $400k: -42%
- $200k to $300k: -71%
- $200: dead.
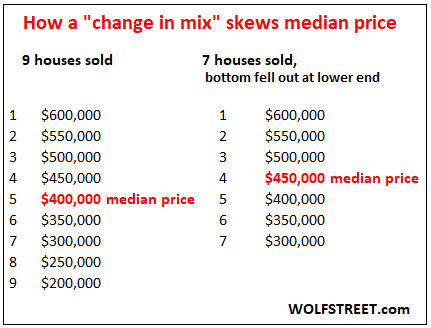
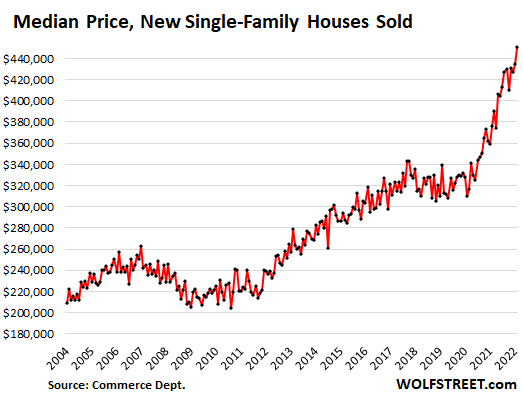
Collapse in sales below $400K changed the mix, skewing the median price.
The median price is the price in the middle. My favorite example: To get the median price in a market where 9 homes sold, you list them by price from the highest to the lowest, and the price of the fifth house from the top or the fifth from the bottom (same house) is the price in the middle, which forms the median price.
Now imagine, two buyers that would have bought the cheapest two houses can’t afford to buy them, and the sales don’t happen. But the remaining seven homes sell. The middle is now the fourth house down, or the fourth house up. This change in mix skews the metric of the median price simply by the way the median price is determined, though the prices of the homes haven’t changed:
And this change in mix is what happened in reality too. The mix changed dramatically, with the bottom falling out below $400k in terms of sales, but sales above $400k were able to hang in there. And this change in mix pushed up the median price to a new record of $450,600, up by 19.6% from a year ago:
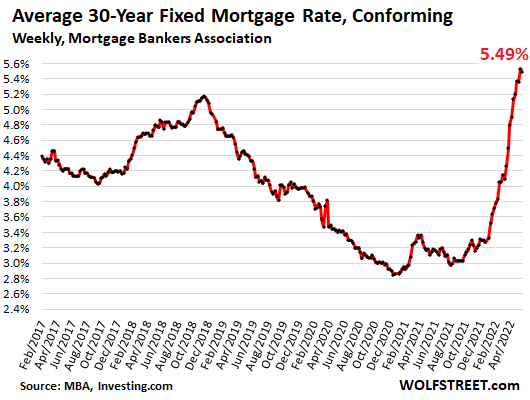
Homebuyers struggle with spiking mortgage rates which make the high home prices that much more difficult to deal with. And with each increase in mortgage rates, and with each increase in home prices, entire layers of potential buyers abandon the market, and sales volume plunges:
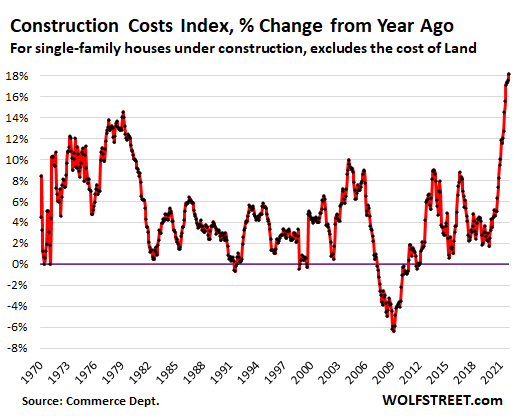
Homebuilders struggle with the worst inflation ever in construction costs, amid shortages of materials, supplies, and labor that tangle up construction projects, cause huge delays and cost-overruns, stall deliveries of completed houses, and cause immense frustration all around.
Construction costs of single-family houses – excluding the cost of land and other non-construction costs – spiked by 18.2% year-over-year, the worst spike ever in the data going back to 1964, and the fifth month in a row with year-over-year spikes of over 17%, according to separate data from the Census Bureau today. April was the 12th month in a row with double-digit cost spikes – which explains in part why the bottom is falling out at homes below $400,000:
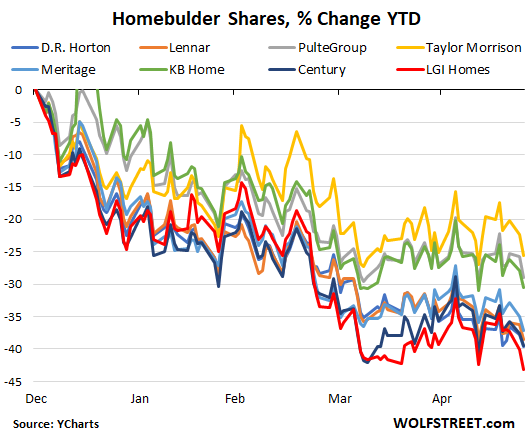
Homebuilder stocks have gotten crushed for months, and swooned again today upon the news. This list and chart of the major homebuilders show the year-to-date declines in percent as of early afternoon today (data via YCharts):
- R. Horton: -39.6%
- Lennar: -38.5%
- PulteGroup: -29.0%
- Taylor Morrison: -25.5%
- Meritage: -37.2%
- NVR: -31.2
- KB Home: -30.6%
- Century: -39.5%
- LGI Homes: -43.1%
Enjoy reading WOLF STREET and want to support it? Using ad blockers – I totally get why – but want to support the site? You can donate. I appreciate it immensely. Click on the beer and iced-tea mug to find out how:

Would you like to be notified via email when WOLF STREET publishes a new article? Sign up here.
![]()
[ad_2]
Source link
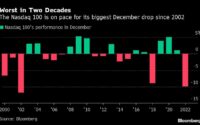
Tech Stocks Head for Worst December Since 2002 as Fed Optimism Fades
Why Britain is still paying the price for Gordon Brown’s bullion blunder