May Research Letter – Too Soon
Too Soon to Buy the Dip, Unless It’s Commodities
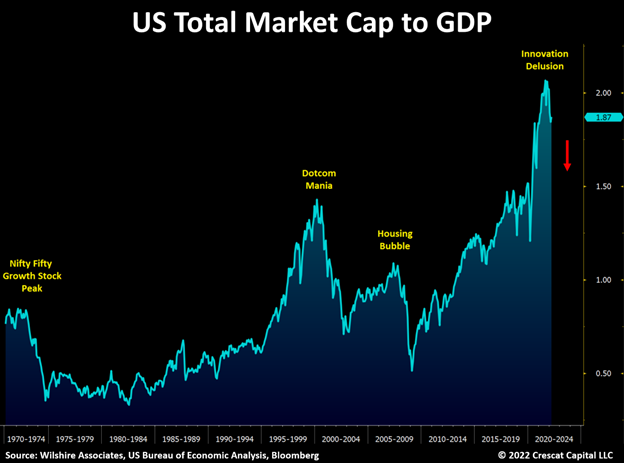
The valuation of the Wilshire 5000 US Total Stock Market Index reached a historic high of 207% of GDP in 2021 in the wake of the Covid-19 stimulus and record corporate earnings. We are now entering what in Crescat’s analysis is an inflationary recession. The index is off 15% from its all-time highs but still trading at 187% of GDP. During comparable stagflations of the early 1970s and 1980s, the associated equity bear markets did not end until the total stock market capitalization traded down to an average of 35% of GDP. Even if nominal GDP were to grow a full 20% over the next two years, not out of reason in today’s historically high inflationary environment, there is the potential for a further 78% decline in stock prices from current levels to settle at the low multiples of the last stagflationary era. While the market could bottom at higher multiples this time around, we must acknowledge the downside risk if we are indeed in just the early stages of new stagflationary regime.
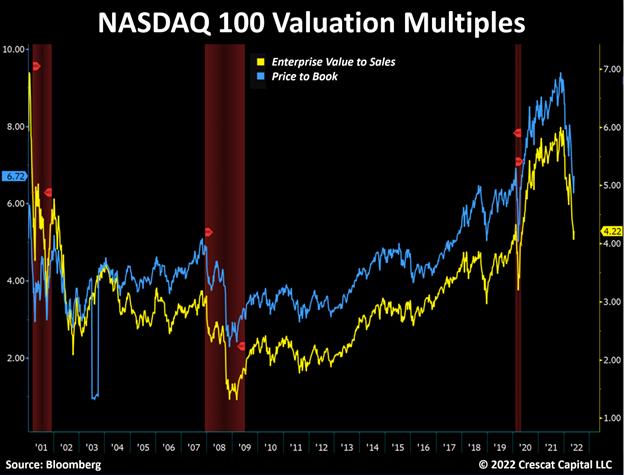
Similarly, the popular NASDAQ 100 Index is already 23% off its highs, but it is still trading at lofty valuation multiples with price to book and enterprise value to sales multiples of 6.7 and 4.2 respectively. If we look at comparable bear market regimes, there is still substantial downside risk for this large cap tech index. For instance, after the tech bust in October 2002, the NASDAQ 100 bottomed with a price to book value of 2.7 and an enterprise value to sales ratio of 2.1. And, during the Global Financial Crisis, in March 2009, the index bottomed with multiples of 2.5 and 1.3 respectively. Conservatively, if we assume flat sales and earnings over the next one to two years during a probable recession, there is another 50% to 69% downside risk. Sure, the market may bottom at higher valuations, but this is the eyes-wide-open risk based on math and history.
The Great Rotation
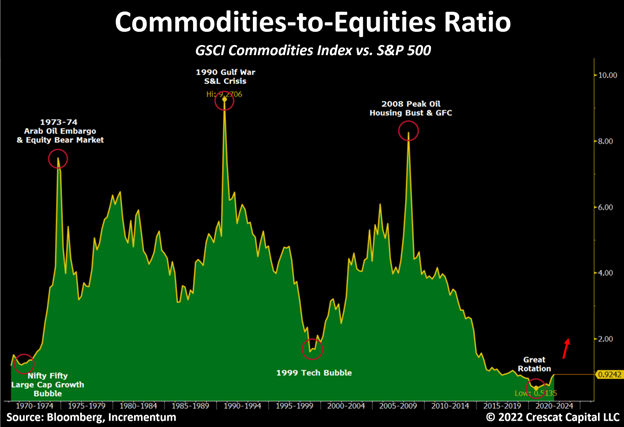
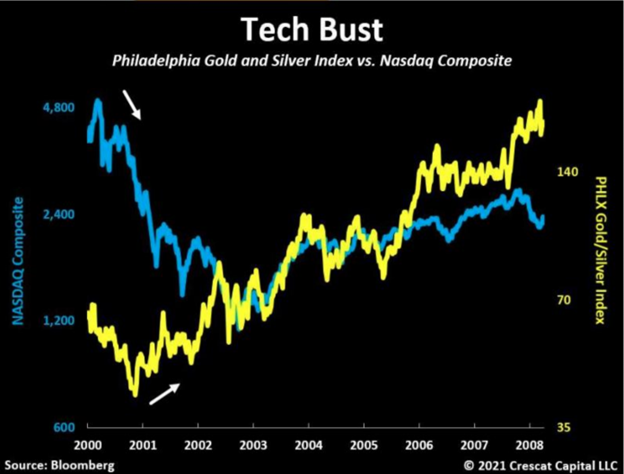
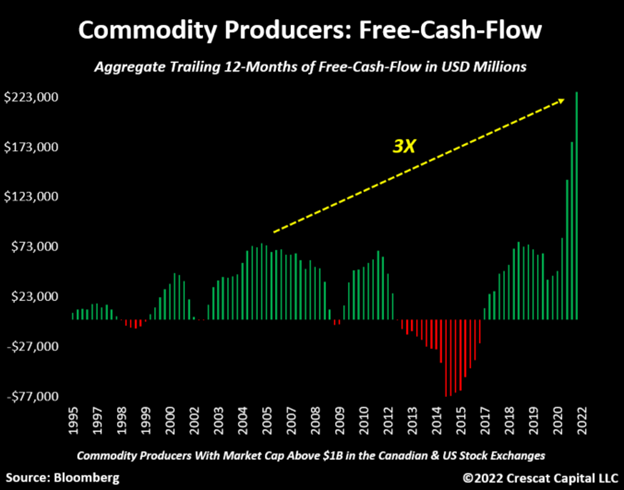
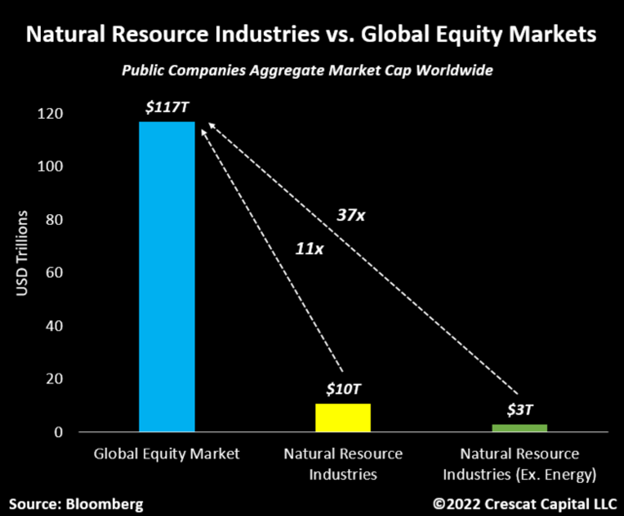
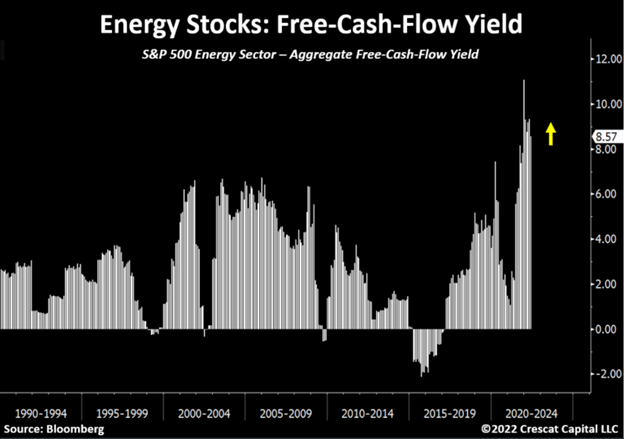
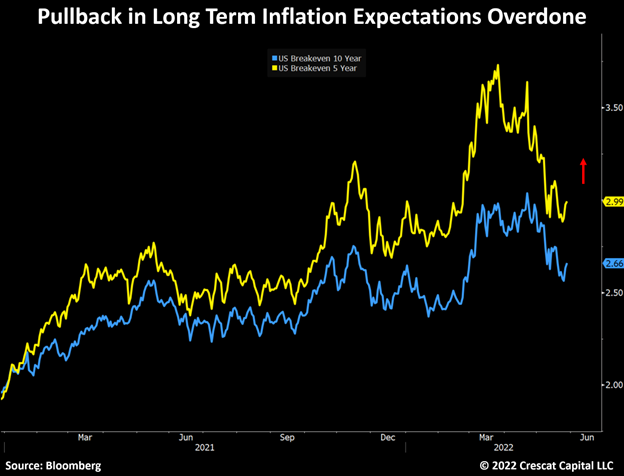
Despite the downside risk in the market at large, it is extremely important to note that there is tremendous value, medium-term growth, and upside appreciation potential in a narrow segment of the stock market today: commodity producers. It is still very early, in our analysis, in the rotation cycle out of overvalued growth equites and low yielding fixed income securities and into commodities. It is just like early 1973 and early 2001 in our view the three charts below help make evident:
It is important to emphasize that we remain short a variety of industries and individually picked equities driven by Crescat’s Equity Quant Model in our Global Macro and Long/Short hedge funds at the same time as we are long a variety of commodity related explorers and producers.
It is All About the CAPEX Cycle
The macro case for inflation being around at a higher rate for longer and contributing to a further bear market in financial assets is based first and foremost on structural commodity supply shortages today. There has been a multi-year declining investment trend in capital expenditures of commodity producers necessary to boost output. This is in large part the result of a policy error based on an aggressive green agenda that has lacked the foresight and coordination with industry for a viable clean energy transition. Instead of cooperating with companies that produce critical commodities necessary for food, energy, and basic materials, environmental, social and government policy makers have attacked these industries. The onslaught has translated into a multi-year declining trend of investment in these critical sectors of the economy despite ongoing global population growth and inelastic demand for the resources they produce. These industries have long lead times, so output cannot be ramped up without years of increased investment. As a result, the world now faces a commodity supply cliff and likely parabolic increase in energy and food prices. As the three charts below illustrate, the underinvestment in commodities has been a slow-motion train wreck. In our view, it will lead to crippling stagflation over the medium term, and it is only the beginning.
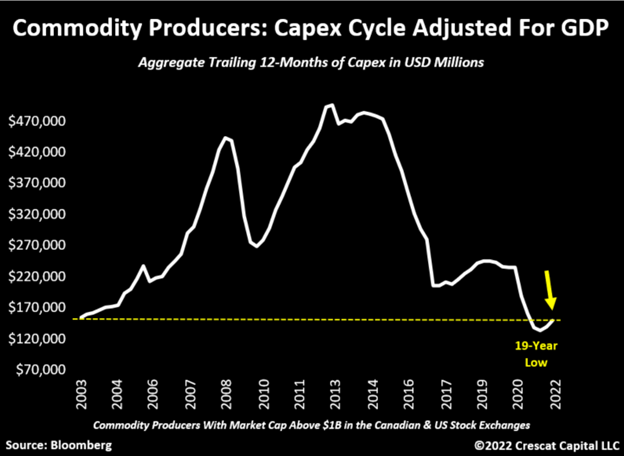
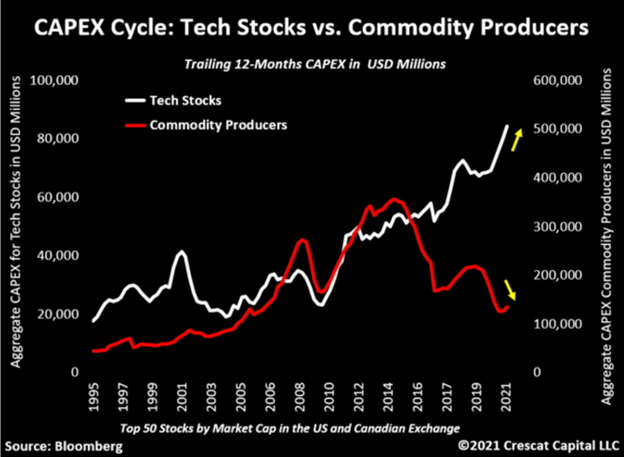
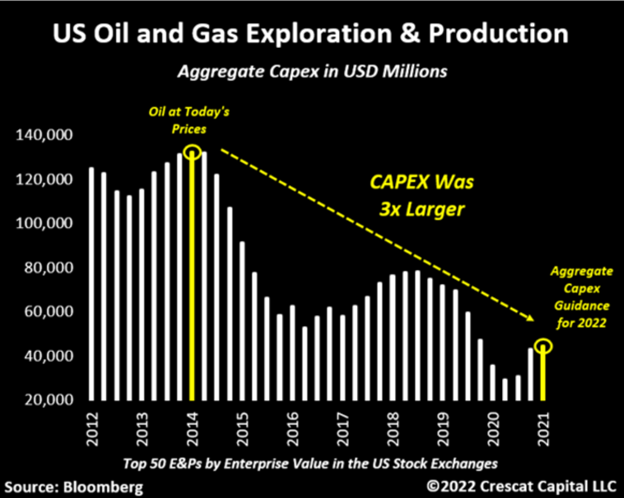
The value and fundamental medium-term growth opportunity in commodity stocks in contrast to the market at large is illustrated in the following three charts:
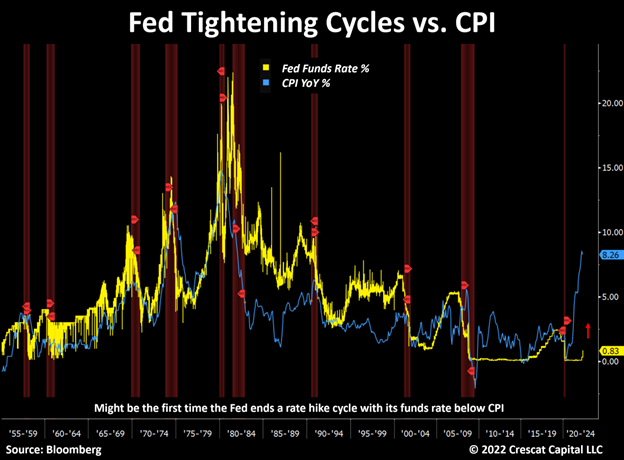
The Fed is Trapped
The Fed’s main policy tool for fighting inflation is to hike interest rates. This reduces the demand side of the economy by tightening credit conditions and causing financial asset prices to decline which crimps investor savings and consumer demand and increases unemployment. But raising interest rates does not stimulate commodity supplies, the core inflationary problem today. In fact, raising interest rates could have the opposite effect because it makes the cost of capital for investment in new commodity production higher.
After years of money printing and interest rate suppression, policy makers have created a historic speculative environment in financial assets. But now, the inflation genie is out of the bottle, and to restore its credibility, the Fed has no choice but to burst the bubble. At the same time, it is powerless to stop commodity inflation. To illustrate just how trapped the Fed is, it has never ended a hiking cycle with the Fed Funds Rate below CPI. But the implied terminal rate in the Fed Funds Futures market is now just 2.9% in early 2023 while CPI is still at 8.3%. If the efficient market hypothesis holds, which it rarely does, CPI must drop precipitously over the next three quarters. Such is highly unlikely based on our commodity supply analysis shown above. There is a much bigger risk based on our work that inflation stays elevated, and the Fed ends up having to hike more and for longer than is currently priced in, as in all past tightening cycles. Alternatively, there is the risk that the stock market correction continues under the existing planned increases and the Fed panics and ends its hiking cycle for the first time with real rates still in negative territory. In all cases, the market seems to be in state of delusion today with the average participant still buying the dip in overvalued tech, crypto, and fixed income assets, hoping for a return to those manias, while underestimating the risk of continued high inflation in valuable, scarce, tangible resources.
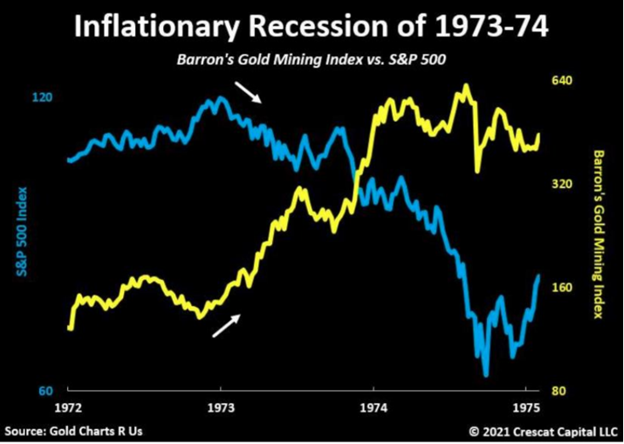
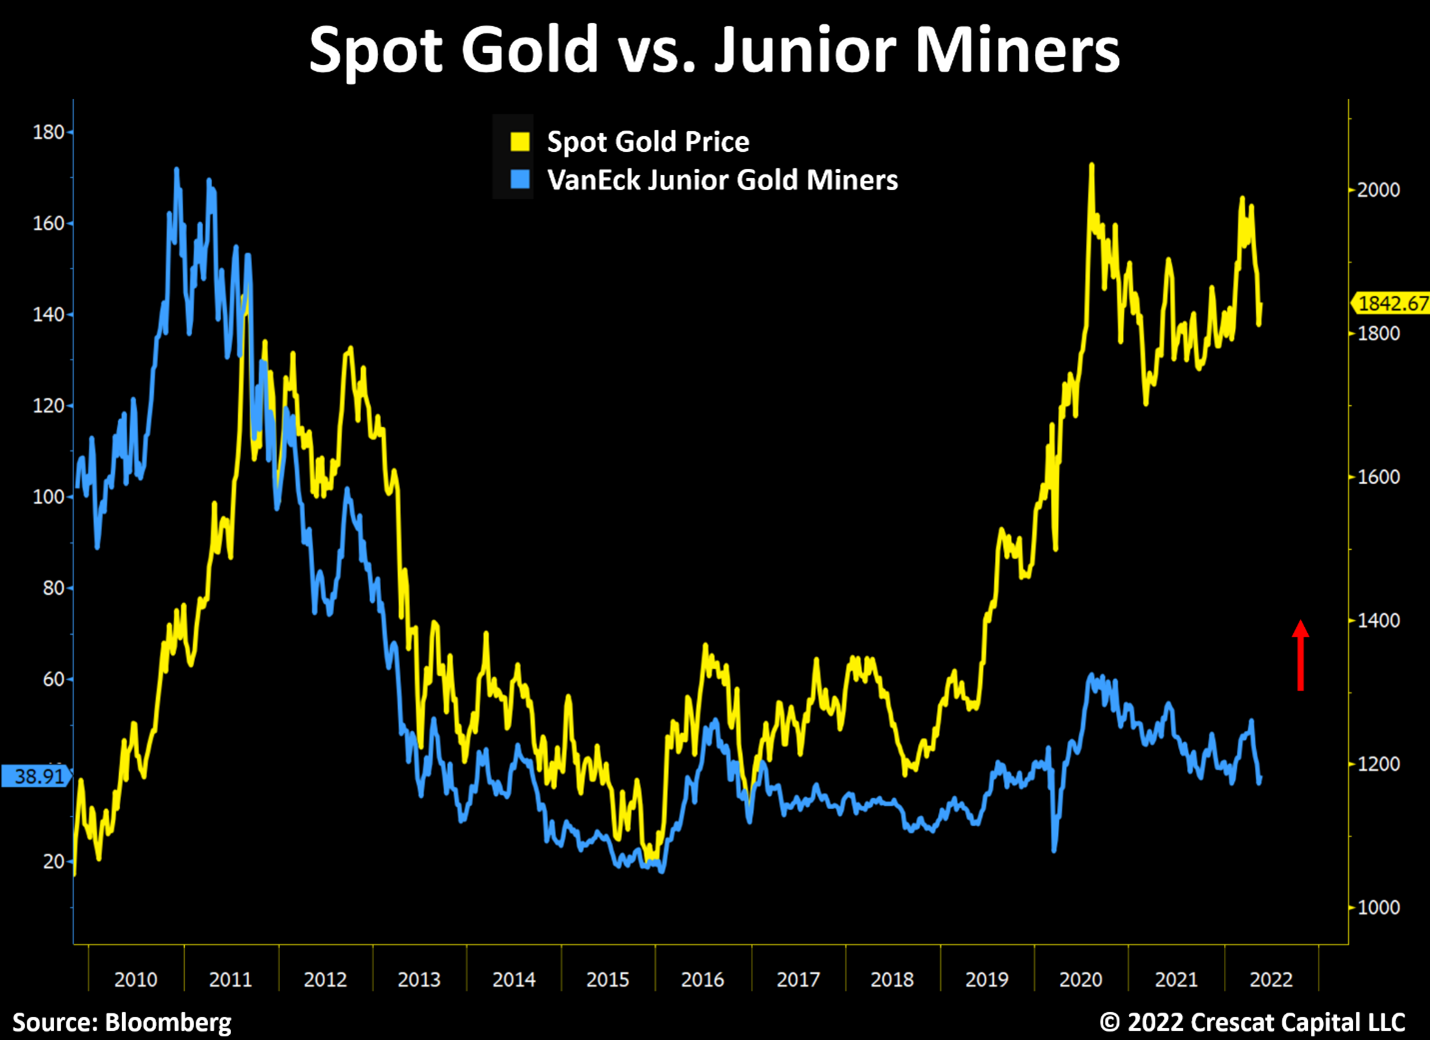
In our analysis, the overwhelming best deep value, high medium-term growth, and high appreciation potential macro investment opportunities in the market today are in commodity exploration and production equities. As a result, we believe smart money investors will increasingly seek both inflation protection and outsized real returns in fundamentally sound businesses that produce valuable scarce resources. Along with energy, base metals, agriculture, and forest products, precious metals miners are where some of the deepest value and appreciation potential lies in the market today. Look at the appreciation potential in junior gold and silver miners relative to gold based on the historical relationship below.
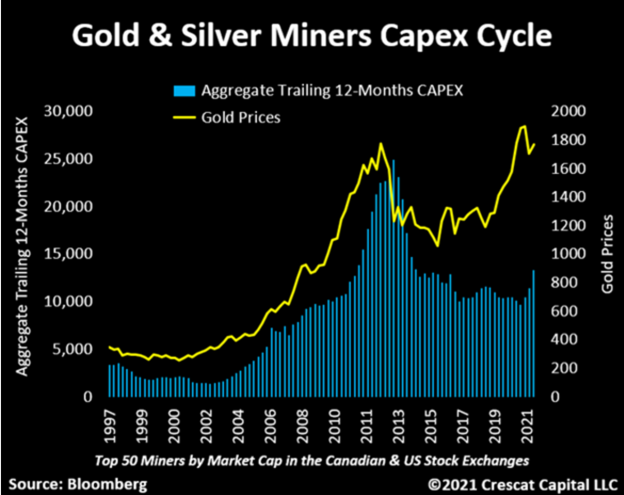
Gold and silver miners have had one of the longest declining CAPEX cycles ever setting up a huge macro supply imbalance. Note, the long-term trend has only just begun to turn back up.
Crescat’s Activist Metals Strategy
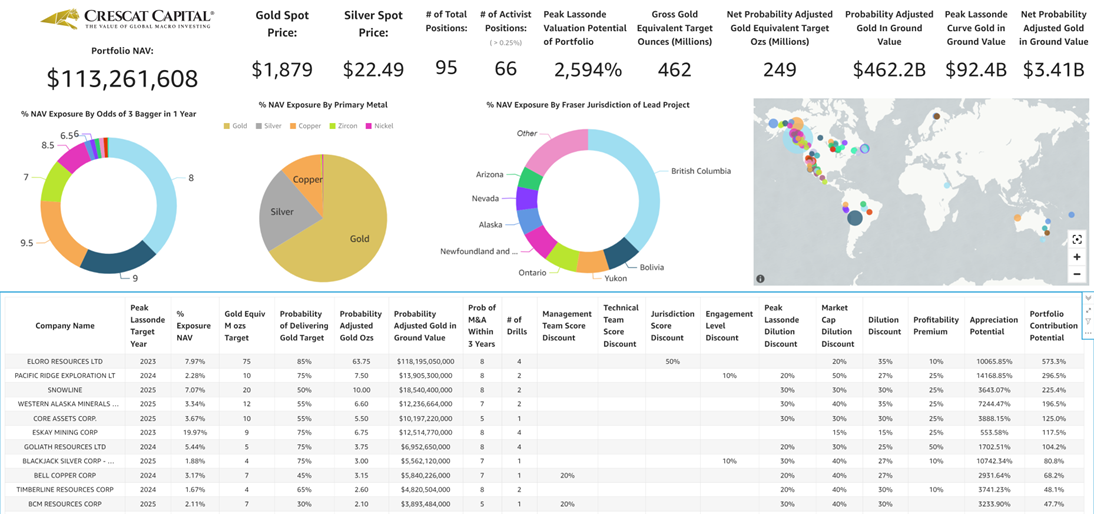
Crescat’s exploration heavy activist precious metals portfolio has appreciation potential of 27 times in our model compared to where the market is pricing it today, at current metals prices. Our macro call is for substantially higher metals prices. We have been buying gold in the ground for 1 to 2 pennies on the dollar relative to our probability-adjusted discovery target resource estimates. We believe our investments can appreciate multiples based on the average historic returns of companies in the industry that have delivered exploration success.
Many of our portfolio holdings are indeed delivering new high-grade discoveries in viable jurisdictions in an undersupplied market. This is all ahead of a likely M&A cycle. While the average market participant seems perversely apathetic to the precious metals mining industry today, we see it as an incredible value buying opportunity. Below is snapshot of our proprietary model including our top 10 positions in terms of expected contribution to future performance. In total, we have 66 activist positions. We own between 5% and 20% of the stock in most these companies on a partially diluted basis that includes warrants. Under the guidance of Quinton Hennigh, PhD, our geologic and technical director, we have invested in businesses with 249 million probability-adjusted target gold equivalent ounces of metal. We expect our companies to have 170 drills turning over the next twelve months cranking out new discoveries. We are extremely excited about the deep value and high appreciation potential of our portfolio.
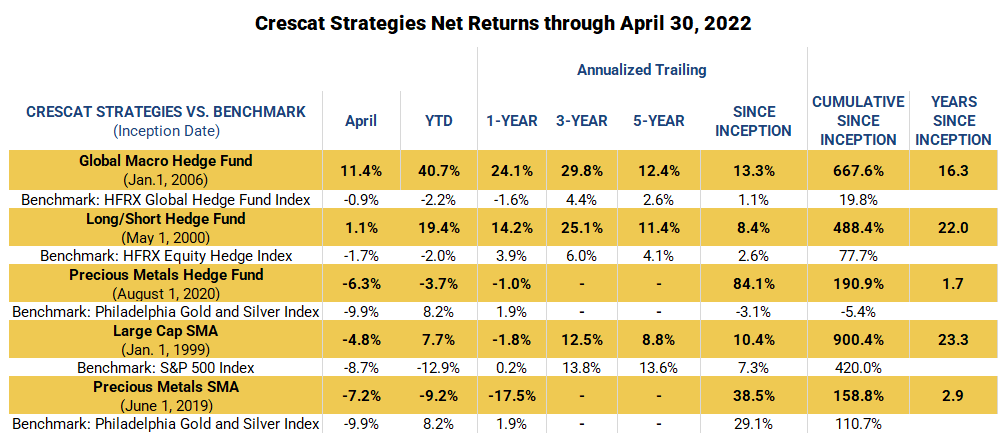
Net Performance Since Inception
Download PDF Version
Sincerely,
Kevin C. Smith, CFA
Member & Chief Investment Officer
Tavi Costa
Member & Portfolio Manager
For more information including how to invest, please contact:
Marek Iwahashi
Client Service Associate
303-271-9997
Cassie Fischer
Client Service Associate
(303) 350-4000
Linda Carleu Smith, CPA
Member & COO
(303) 228-7371
© 2022 Crescat Capital LLC
Important Disclosures
Performance data represents past performance, and past performance does not guarantee future results. An individual investor’s results may vary due to the timing of capital transactions. Performance for all strategies is expressed in U.S. dollars. Cash returns are included in the total account and are not detailed separately. Investment results shown are for taxable and tax-exempt clients and include the reinvestment of dividends, interest, capital gains, and other earnings. Any possible tax liabilities incurred by the taxable accounts have not been reflected in the net performance. Performance is compared to an index, however, the volatility of an index varies greatly and investments cannot be made directly in an index. Market conditions vary from year to year and can result in a decline in market value due to material market or economic conditions. There should be no expectation that any strategy will be profitable or provide a specified return. Case studies are included for informational purposes only and are provided as a general overview of our general investment process, and not as indicative of any investment experience. There is no guarantee that the case studies discussed here are completely representative of our strategies or of the entirety of our investments, and we reserve the right to use or modify some or all of the methodologies mentioned herein.
Separately Managed Account (SMA) disclosures: The Crescat Large Cap Composite and Crescat Precious Metals Composite include all accounts that are managed according to those respective strategies over which the manager has full discretion. SMA composite performance results are time weighted net of all investment management fees and trading costs including commissions and non-recoverable withholding taxes. Investment management fees are described in Crescat’s Form ADV 2A. The manager for the Crescat Large Cap strategy invests predominatly in equities of the top 1,000 U.S. listed stocks weighted by market capitalization. The manager for the Crescat Precious Metals strategy invests predominantly in a global all-cap universe of precious metals mining stocks.
Hedge Fund disclosures: Only accredited investors and qualified clients will be admitted as limited partners to a Crescat hedge fund. For natural persons, investors must meet SEC requirements including minimum annual income or net worth thresholds. Crescat’s hedge funds are being offered in reliance on an exemption from the registration requirements of the Securities Act of 1933 and are not required to comply with specific disclosure requirements that apply to registration under the Securities Act. The SEC has not passed upon the merits of or given its approval to Crescat’s hedge funds, the terms of the offering, or the accuracy or completeness of any offering materials. A registration statement has not been filed for any Crescat hedge fund with the SEC. Limited partner interests in the Crescat hedge funds are subject to legal restrictions on transfer and resale. Investors should not assume they will be able to resell their securities. Investing in securities involves risk. Investors should be able to bear the loss of their investment. Investments in Crescat’s hedge funds are not subject to the protections of the Investment Company Act of 1940. Performance data is subject to revision following each monthly reconciliation and annual audit. Current performance may be lower or higher than the performance data presented. The performance of Crescat’s hedge funds may not be directly comparable to the performance of other private or registered funds. Hedge funds may involve complex tax strategies and there may be delays in distribution tax information to investors.
Investors may obtain the most current performance data, private offering memoranda for a Crescat’s hedge funds, and information on Crescat’s SMA strategies, including Form ADV Part II, by contacting Linda Smith at (303) 271-9997 or by sending a request via email to [email protected]. See the private offering memorandum for each Crescat hedge fund for complete information and risk factors.
[ad_2]
Source link

Biden’s Executive Order a Direct Threat to the Dollar

Treasury bond auction runs into weak demand amid fears that soaring US debt will overwhelm Wall Street