By How Much Can the Fed Reduce its Assets with QT? Fed’s Liabilities set a Floor
The Fed’s big liabilities: reserves, US paper dollars, RRPs, and the US government checking account. Reserves already plunged by $1.03 trillion.
By Wolf Richter for WOLF STREET.
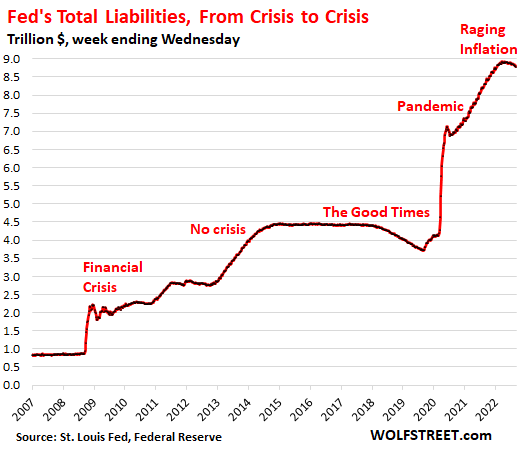
Normally when we look at the Fed’s balance sheet, we discuss its assets: Treasury securities, MBS, repurchase agreements (repos), swaps, SPVs, etc. Under the new regime of Quantitative Tightening (QT), total assets have dropped by $139 billion from the peak, as of its balance sheet released on September 1.
But it’s the liabilities that limit how far the Fed’s assets can theoretically drop under QT. By looking at the path of those liabilities, we can project the theoretical bottom of QT, below which the Fed cannot go.
On every balance sheet, total assets = total liabilities + capital.
Capital is easily dispensed with: The amount of capital is capped by Congress. Total capital is currently $42 billion, which is minuscule, but that’s how Congress wants it. So be it.
Total liabilities: $8.78 trillion, down by $139 billion from the peak on April 13. Liabilities are what the Fed owes other entities. We’re going to look at the four largest liabilities, which account for nearly all of the liabilities:
- Bank reserves: $3.25 trillion
- US paper dollars (“Currency in circulation”): $2.28 trillion.
- Reverse repurchase agreements (RRPs), total: $2.53 trillion
- US Government’s checking account at the Fed: $670 billion.
Total liabilities parallel total assets, the only difference being the minuscule amount of capital. But the composition of those liabilities has changed dramatically, as we’ll see in a moment:
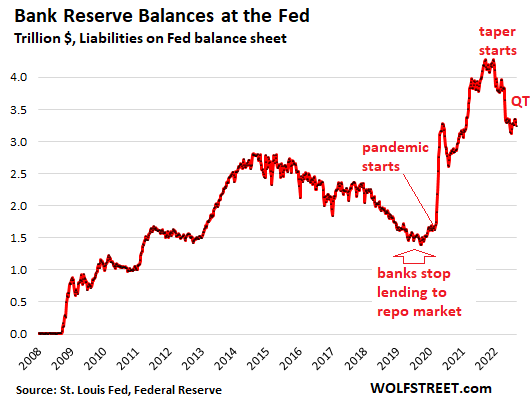
Reserves plunged by $1.03 trillion since Dec. 2021.
Reserve balances peaked in December 2021, after the Fed had begun reducing its asset purchases. Since then, reserve balances have plunged by $1.03 trillion, including by $59 billion over the past week:
“Reserves” are cash that banks put on deposit at the Fed. Banks use their reserve accounts at the Fed to transfer money to and from other banks. They’re a liability on the Fed’s balance sheet because they’re money that the Fed owes the banks. Banks on their own balance sheets carry them as assets, and don’t call them “reserves” but “interest-earning deposits,” or similar.
The Fed currently pays 2.4% interest on reserves; they are the most liquid, risk-free interest-paying asset banks can invest in, and they also figure into the banks’ regulatory capital.
Alternatively, banks could invest some of this cash in short-term Treasury securities (Treasury bills). The one-month Treasury yield was 2.49% on Friday. But Treasury bills provide less liquidity than reserves. Banks could also send cash to the Fed via overnight RRPs, but the Fed only pays 2.3% on RRPs.
Reserves are a manifestation of liquidity in the banking system that is now not chasing after other assets.
QE created liquidity that then went chasing after all kinds of assets and drove asset prices higher.
QT drains liquidity from the financial system, and generally speaking, one of the aspects of this liquidity being drained is a drop in reserves.
But the $1-trillion plunge in reserves, after only $139 billion in QT, is due in part to a shift to RRPs via Treasury money market funds. More in a moment.
How far can reserves drop? Fed’s “Ample reserves regime.”
As QT plows forward, reserve balances are going to shrink further. How far can they shrink? We have some history on this.
Under the last QT regime from Nov. 2017 through Aug. 2019, reserves dropped as expected. But when they hit a low of $1.4 trillion in September 2019, the banks stopped lending to the repo market. They had reasons because overleveraged mortgage REITs and some hedge funds that were borrowing in the repo market short term to fund long-term bets were beginning to blow up. Fearing contagion from the huge repo market, the Fed stepped in and bailed it out.
It then said that its monetary policy is based on an “ample reserves regime,” a floor of sorts, meaning it wants banks to have “ample” cash on deposit at the Fed. It didn’t mention a figure, but it phased out its repo market bailout once reserves reached $1.6 trillion.
But this time, the Fed has “standing repo facilities.”
In preparation for QT, the Fed last summer revived its “standing repo facilities” that it used to have before the Financial Crisis, but shut down as QE commenced in 2008. These SRFs for repos and reverse repos allow the Fed to step in real time if the repo market threatens to wobble. So this one is likely not going to blow out again.
So what are the minimum reserves under the “ample reserves regime,” combined with the safety feature of the SRF?
We will find out, and it could be less than $1.6 trillion because of the safety feature. But let’s stick for now with $1.6 trillion as the minimum.
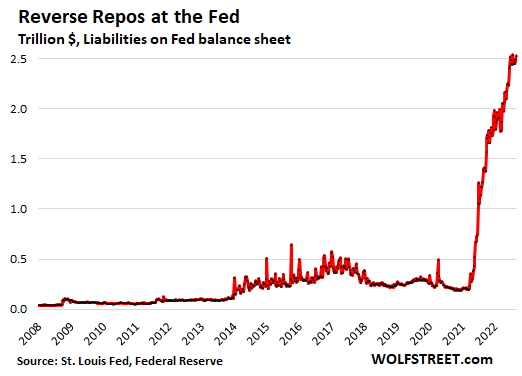
Reverse repurchase agreements.
Under these contracts, the Fed takes in cash and hands out collateral (Treasury securities). They’re a liability because it’s money that the Fed owes its counterparties. The Fed pays 2.3% in interest on this cash.
The Fed offers two groups of reverse repurchase agreements, and both combined total $2.53 trillion:
- “Foreign official and international accounts,” where foreign central banks park their dollar cash: $277 billion
- “Others” which are the “overnight RRPs” mostly with Treasury money market funds: $2.25 trillion.
Total RRPs started spiking in April 2021, but since June 2022, have been roughly stable in the $2.5 trillion range.
The overnight RRPs, currently $2.25 trillion, are cash from Treasury money-market funds.
Starting early last year, Treasury money market funds got flooded with cash. They normally would buy Treasury securities with short maturities, but demand was so high that short-term yields dropped to 0% and briefly below 0%. A negative yield is a problem for money market funds because it might cause them to “break the buck,” where a unit’s value might drop below $1, which could trigger a run on the fund, which could spiral out from there, which is why the Fed started offering RRPs, and then started paying interest on them.
And there’s now another reason for the surge in RRPs: Treasury money market funds have started to shift their short-term cash that they need to keep on hand to RRPs, from their bank accounts, because the Fed pays higher interest on that cash. In addition, RRPs offer essentially zero credit risk, which is not the case with large bank account balances.
What this means for the Fed’s balance sheet: A shift from reserves to RRPs, and this could explain why reserves plunged by $1 trillion over the past 8 months, as RRPs have shot higher.
How low can RRPs go?
In theory, they can drop to near-zero as liquidity is wrung from the system via QT. There is no reason for the Fed to maintain a minimum balance of RRPs. This is demand based, and as other interest rates rise and liquidity vanishes, RRPs could drop to very low levels four years from now. So for our theoretical minimum, let’s say this is near $0.
Paper Dollars: after spiking, demand has flattened.
Currency in circulation – the paper dollars in your pocket, aka Federal Reserve Notes – is demand based through the US banking system. If customers demand paper dollars at the ATM or at the counter, the bank must have enough on hand. In other countries, foreign banks have relationships with US banks to provide paper dollars to their customers.
US banks get those paper dollars from the Fed in exchange for collateral, such as Treasury securities. In other words, as demand for paper dollars rises, banks must get more paper dollars from the Fed, and to get them, must post more collateral at the Fed. As the liability of currency in circulation increases, the collateral, such as Treasury securities, also increases the assets on the Fed’s balance sheet.
Before QE, currency in circulation was the primary driver of the increase in assets on the Fed’s balance sheet. And demand has been huge – but not for payment purposes.
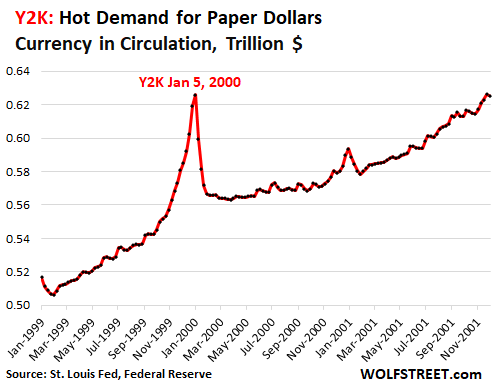
Paper dollars are stashed under mattresses, in vaults, and in suitcases around the world. When there is a crisis – or a potential crisis, such as Y2K – in the US, people stock up on paper dollars.
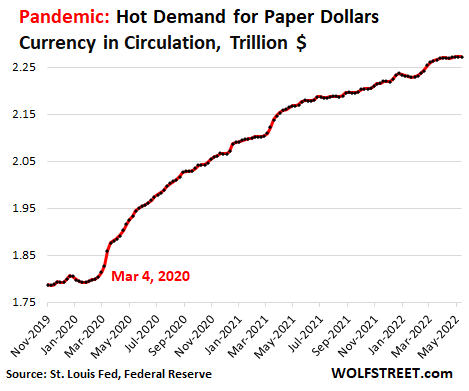
Currency in circulation, after spiking throughout the pandemic, started leveling off in early July, and has now inched down a tad, to $2.28 trillion:
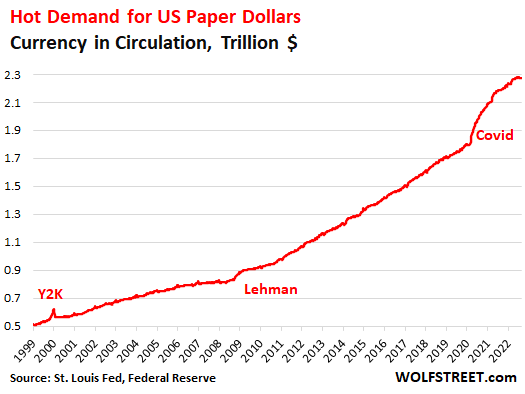
Remember Y2K? Which was a dud. But everyone stocked up on paper dollars, and demand spiked, and after the dud, the extra cash went back to the Fed via the banks:
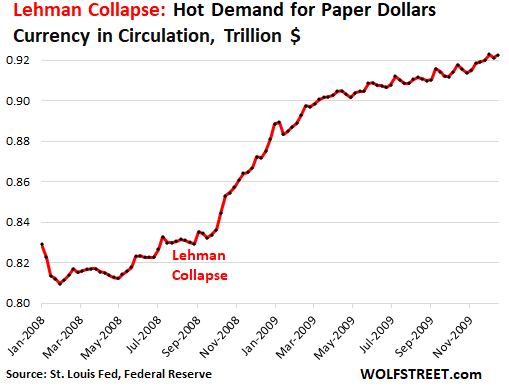
The bankruptcy of Lehman Brothers in September 2008, which opened up the long-brewing Financial Crisis for all to see, sent people to ATMs, pulling cash out just in case. By late 2009, this was starting to normalize again:
During the pandemic, there was huge demand for cash. Between late February 2020 and December 2021, currency in circulation spiked by 25%. There is some chance that some of this could unwind:
Each time there is an increase in currency in circulation, the Fed’s asset increase by the amount of the collateral that banks post to get the paper dollars.
Currency in circulation will likely continue to increase.
A four-year decline in currency in circulation, as customers take paper dollars back to the bank, though theoretically possible, seems unlikely in normal times.
Instead, over the next four years, I expect currency in circulation to increase at the pre-pandemic rate of about $100 billion per year, thereby adding about $100 billion per year in collateral to the Fed’s assets. So four years from now, we might be looking at $2.7 trillion in currency in circulation.
The Treasury General Account.
The government’s checking account is with the Federal Reserve Bank of New York. The amount that the government has on deposit there is a liability for the Fed because it’s money that the Fed owes the government.
The level of deposits has been swinging wildly, driven by protracted debt-ceiling fights when the government nearly runs out of cash before Congress relents, and by the government’s super-massive debt issuance early on in the pandemic to pay for the stimulus programs. That debt issuance raised a huge amount of cash that took a while to draw down.
And now there is a new element: Raging inflation, which drives up outlays and revenues. Over the years, as larger amounts flow through the checking account, the average balance will likely increase to accommodate the larger flows.
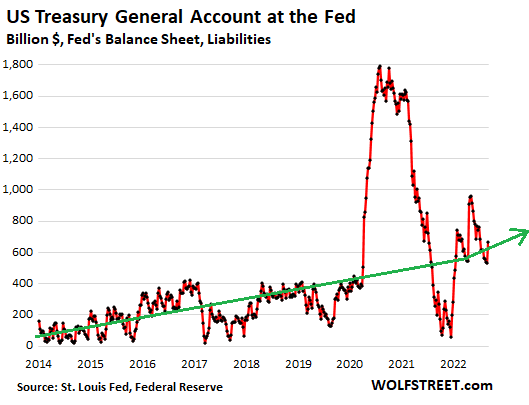
As of the Fed’s balance sheet released on September 1, the government had $670 billion on deposit at the Fed. The green line represents the pre-pandemic trend of the increase of the account balance on average. I made a kink into the green line, starting early 2021, when raging inflation kicked off to show the long-term trend under much higher inflation.
Given the erratic nature of these TGA balances, I’m going to go out on a limb and estimate that the average balance in fours years might be around $800 billion.
The floor for liabilities in four years: $5.2 Trillion
In summary, four years from now, the floor of the Fed’s total liabilities would be at $5.2 trillion:
- Reserves: $1.6 trillion
- RRPs: near $0
- Currency in Circulation: $2.7 trillion
- TGA: $800 billion
- Other liabilities beyond the big four: $50 billion
So four years from now, based on these estimates, the floor for total assets on the Fed’s balance sheet would be about $5.2 trillion, below which the Fed could not go. At the peak, the Fed had $8.97 trillion in assets. So my calculus says that the Fed could do a maximum QT of about $3.8 trillion.
This would be a huge reduction in liquidity, and it would sack asset prices. That’s why QT is loathed when its effects become apparent. Look how asset prices have been sagging, and QT has barely started. And something big might blow up before the Fed even gets to the theoretical floor.
But wait… raging inflation may change paper dollar behavior.
If inflation continues to rage, paper dollar holders may get tired of getting mauled, and they might convert those paper dollars into interest-paying assets. If that happens, there could be a significant decline in currency in circulation, and therefore in collateral, that would pull down the Fed’s assets further and would provide for a lower floor.
Decades of relatively low inflation minimized the cost of holding paper dollars, but now that cost is spiking. We might already be seeing some of it because over the past few months, currency in circulation has actually dipped. If this is a trend in the making, a lot of these Federal Reserve Notes might be going back to the Fed, further reducing both sides of the balance sheet, and lowering the floor below which the Fed cannot go.
Enjoy reading WOLF STREET and want to support it? Using ad blockers – I totally get why – but want to support the site? You can donate. I appreciate it immensely. Click on the beer and iced-tea mug to find out how:

Would you like to be notified via email when WOLF STREET publishes a new article? Sign up here.
![]()
[ad_2]
Source link

How American consumers lost their optimism

Lower income households feeling pressure: Campbell Soup CEO