Home Prices Crash At Fastest Pace Since Lehman Bankruptcy
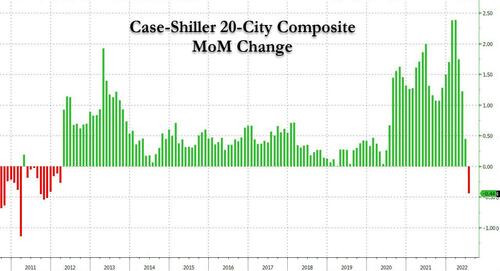
The housing market is finally getting unglued: less than a week after Case Shiller (which reports home prices with a substantiakl laga) reported the first negative monthly change in home prices…
… today Black Knight confirmed that the US housing market has turned decidedly ugly with the two biggest monthly declines since the global financial crisis.
According to a Monday report from mortgage-data provider, median home prices fell 0.98% in August from a month earlier, following a 1.05% drop in July.
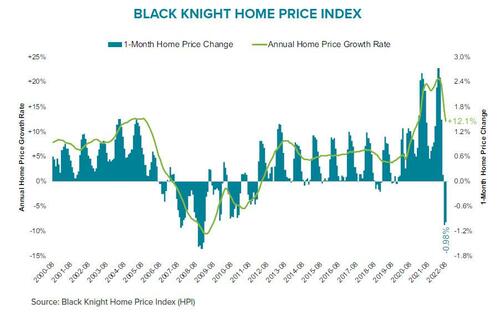
The two periods marked the largest monthly declines since January 2009. In fact, at the current pace of declines, we may soon see a record drop in home prices, surpassing the largest historical slide hit during the global financial crisis.
The report noted that July and August 2022 mark the largest single-month price declines seen since January 2009 and rank among the eight largest on record.
“The Black Knight HPI for August marked the second consecutive month that prices pulled back at the national level, with the median home price now 2% off of its June peak,” said Graboske. “Only marginally better than July’s revised 1.05% monthly decline, home prices were down an additional 0.98% in August. Either one of them would have been the largest single-month price decline since January 2009 – together they represent two straight months of significant pullbacks after more than two years of record-breaking growth. The only months with materially higher single-month price declines than we’ve seen in July and August were in the winter of 2008, following the Lehman Brothers bankruptcy and subsequent financial crisis.
The report also noted that the monthly rate of home price decline is now rivaling that seen during the Great Recession – the question is how long it will continue to do so, and how far off peaks prices will fall.
Separately, the August report also found that after rising sharply from May through July, for-sale inventory levels stalled in August, growing at just 1/10th the rate of recent months, as sellers appeared to take a step back from the market, perhaps waiting for mortgage rates to plunge as the recession arrives.
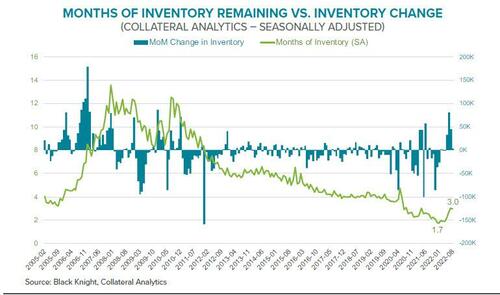
The national inventory deficit held relatively steady at -44%, with the market remaining more than 600K listings short as compared to pre-pandemic levels. For its part, Black Knight suggests that sellers are likely being deterred by both falling demand and prices, along with a growing disincentive to give up historically low interest rate mortgages in a sharply rising rate environment.
That said, and as is the case with Case Shiller, while prices are falling on a month-over-month basis, they’re still significantly higher than a year earlier when the buying frenzy was just getting started: In August, home prices were 12.1% compared to a year ago, if sharply lower from the 20% Y/Y change hit earlier this summer.
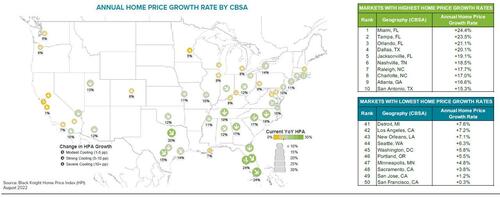
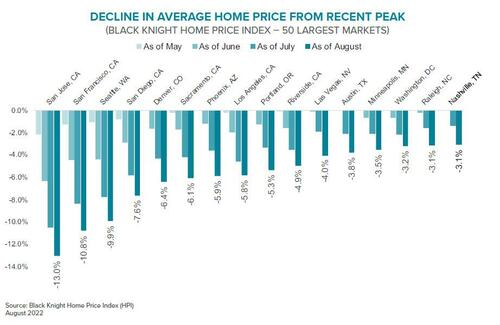
The sharpest correction in August was in San Jose, California, down 13% from its 2022 peak, followed by San Francisco at almost 11% and Seattle at 9.9%, the company said.
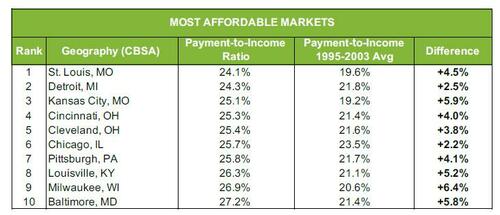
Yet as home prices tumble, there are no surprises in the list of most affordable housing markets, where the usual suspects – those cities where a walk down a street almost guaranteed a gunshot wound – dominate: St Louis, Detroit and Kansas City.
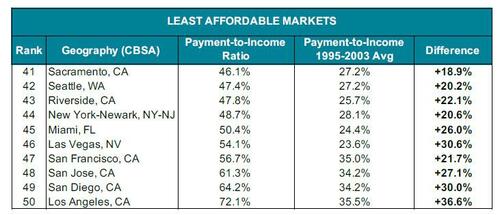
Alternatively, while prices may have dropped, the three most unaffordable MSAs remain on the west coast: Sacramento, Seattle and Riverside.
Full Black Knight report below (pdf link):
[ad_2]
Source link
REAL Mortgage Rates At -3.25%, REAL Wage Growth At -2.99% YoY While REAL Home Price Growing At +11.7% YoY (Powell And Fed Singing “No Sugar Tonight”) – Confounded Interest

Watch: Vast Expanse Of US Military Hardware Positioned At Polish Port