The Bursting Of A Stock Market Superbubble
DNY59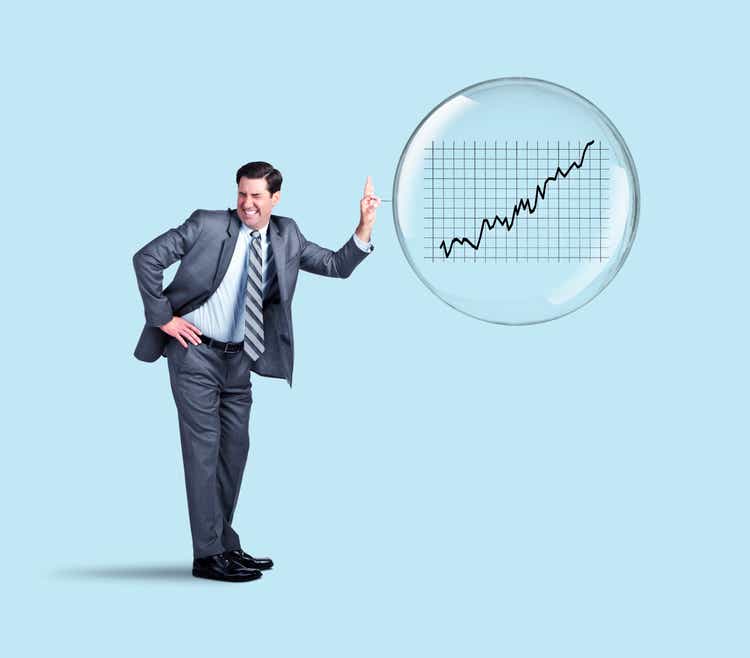
In January of this year, I wrote Lucky 13: History of 13-Year Investment Returns that shows that the 13 years ending 12/31/21 is one of the best on record, so I postulated that the next 13 years might not be so good. The “Roaring 2010s” might have set the stage for the “Depressing 2020s.”
Standard & Poor’s and Target Date Solutions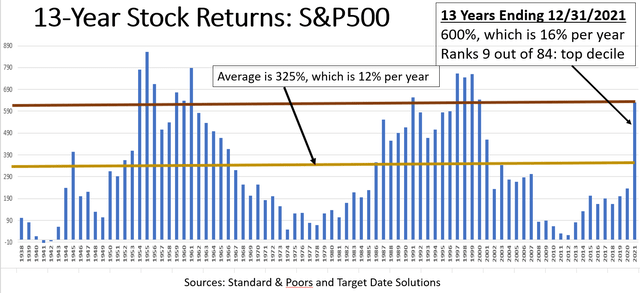
The inflation of a superbubble
The last 13 years are unique in their persistence of good positive investment returns year after year. There was no risk.
Standard & Poor’s and Target Date Solutions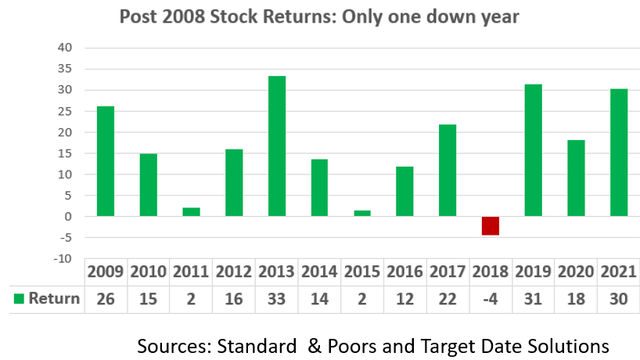
The only “volatility” was prices going up, leading to many articles about the length and magnitude of the recovery from the 2008 crash.
As of the end of 2021, the recovery was the longest on record. By historic standards, a correction was 7.5 years overdue.
Target Date Solutions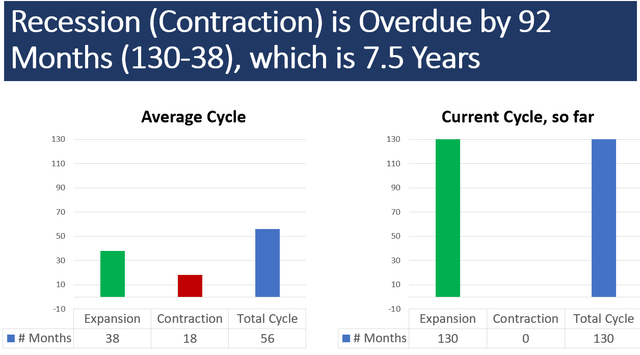
And the magnitude of the rise brought it to superbubble levels, where a superbubble is defined as a market that rises more than 3 standard deviations from the trend. Many measures of expensiveness had risen to this level, like the P/E ratio and the Buffett Indicator.
Business Insider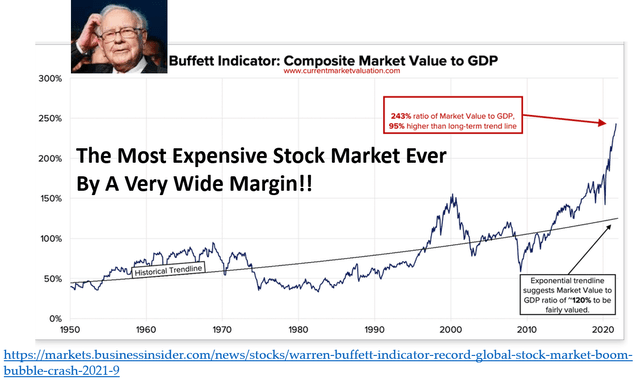
The deflation of a superbubble
So far 2022 has delivered corrections in both stocks and bonds. It’s interesting to note that recent commentators use the word “volatility” to mean losses because it softens the bad news. We now have downside volatility, something we haven’t seen since 2008.
S&P and Vanguard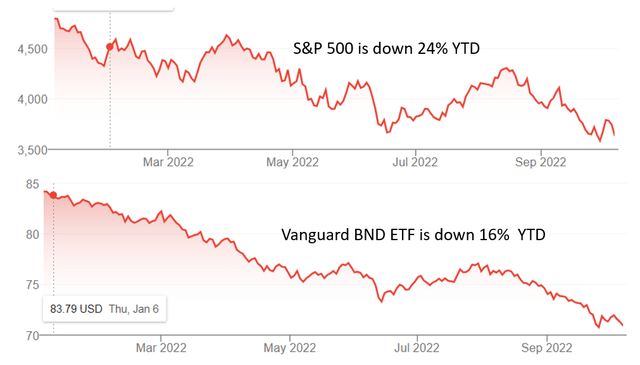
There are many explanations for the declines, including investor behavior. Crestmont Research documents that investor fear takes hold when inflation is extreme – either high or low.
Crestmont Research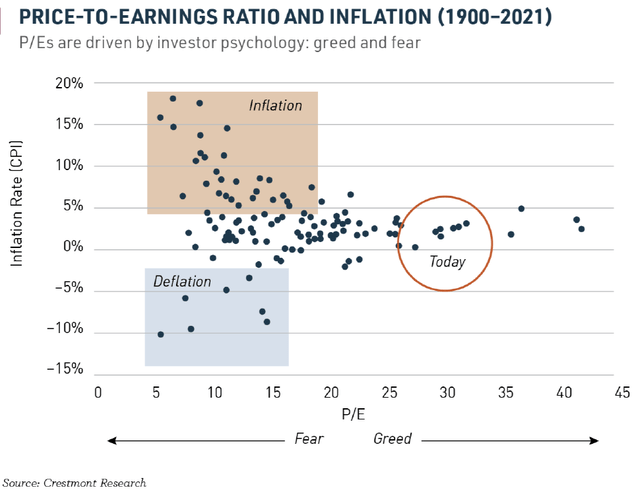
Price/Earnings ratios are a manifestation of investor fear or greed. Investor euphoria leads investors to pay a premium for earnings, while fear makes them frugal.
The question on everyone’s mind is how low will prices go. Many, including Jeremy Grantham, believe the US stock market is bursting a superbubble that according to this article:
Some examples of previous modern superbubbles in the financial markets are the 1929 stock market crash, the 1970s, and the 2000 dot-com bubble. These events are extreme in historical nature and can see drops in prices of 50% to 90%.
If the ultimate decline is between 50% and 90%, the stock market has another 34%-88% drop ahead. The worst may be yet to come.
Conclusion
As is the usual case in bear markets, Wall Street advises “buy the dip” and “stay the course.” That will work if Grantham and others are wrong, and this is not the bursting of a superbubble.
But 78 million baby boomers cannot afford to risk their lifetime savings at this time because most are in the “Risk Zone” during which losses can irreparably spoil the rest of their lives. We each get only one passage through the Risk Zone, and this zone is currently extremely risky. Baby boomers need to move to safety which means Treasury bills and intermediate-term TIPS, in my opinion.
[ad_2]
Source link
University of Michigan survey of consumers shows declining confidence in Fed, commercial banks

The Big Government-Big Bank Plot To Exploit Us