Has this Contorted Labor Market Forced Companies to Change their Thinking about Layoffs?
Looking at the supply-and-demand imbalances and structural changes in the labor market, and what it means for employers.
By Wolf Richter for WOLF STREET.
We still have the most contorted labor market ever, but there are some big shifts, and those shifts make sense. We’re going to look at this picture book backwards. So stay with me. There has been a lot of thinking about the “why,” but I’ll stick to the “how.”
Supply of labor is very tight.
We can look at the readily available supply of labor roughly as the people who are looking for work but don’t have work at the moment. There are different aspects to it. So here we go.
The number of unemployed people near historic lows. People are deemed unemployed if they actively looked for a job during the reference period and don’t have a job. People who didn’t look for a job are not deemed unemployed (retirees, students, day traders, etc.). The number of unemployed ticked up in October from September, to 6.06 million, but remained in the same narrow range since January, and remains historically very low. This is particularly interesting because over the decades, the population in the US has grown:
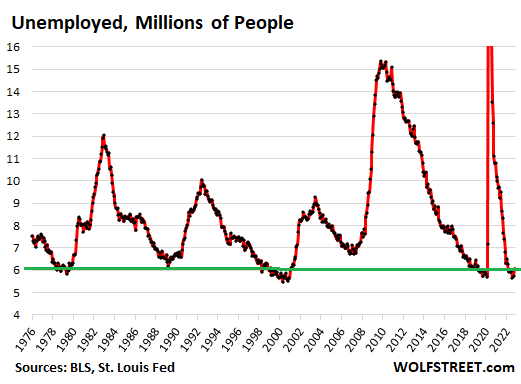
This data came from the Bureau of Labor Statistics today, which obtained it via its large survey of households.
Unemployment insurance claims near historic lows. Well-known companies, such as Lyft, Twitter, Carvana, etc., are now constantly in the news with layoffs. But the numbers are still small – in the hundreds or a few thousand per company – “small,” considering that even in the best of times, there are around 6 million unemployed in the US. And so far, many people that have gotten laid off have found jobs quickly, or already had jobs lined up by the time they were escorted out the building.
So the number of people who filed for unemployment compensation, at 217,000 in the week through last Saturday, as reported by the Department of Labor yesterday, was down a smidgen from the prior week and remains near historic lows.
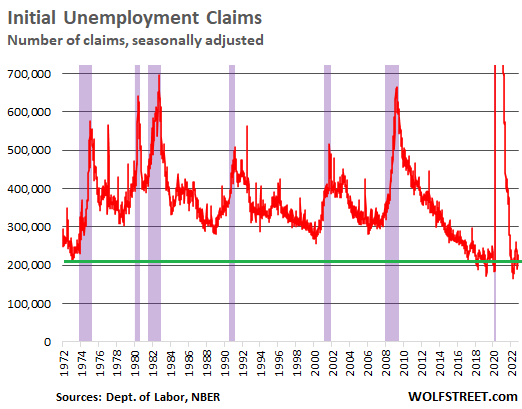
These initial claims for unemployment insurance are weekly and as close to real-time as we can get. They are based on actual applications for unemployment insurance – not on surveys.
What this low number means: across the US in total, not many people are getting laid off, and most of those that are getting laid off are finding jobs quickly, or already have jobs lined up, and don’t even bother to file for unemployment applications.
When initial claims for unemployment insurance begin to surge, it means that not only are more people getting laid off, but also more laid-off people cannot quickly find a new job and therefore jump through the hoops of filing for unemployment insurance.
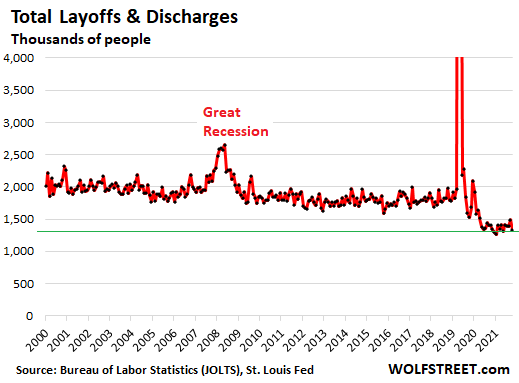
Layoffs and discharges near historic lows. In parallel, the number of layoffs and involuntary discharges, a more lagging data set based on surveys of companies, reported by the BLS three days ago, fell from already low levels toward record lows, to 1.33 million people in September, down from 1.49 million in August, and down by 33% from September 2019:
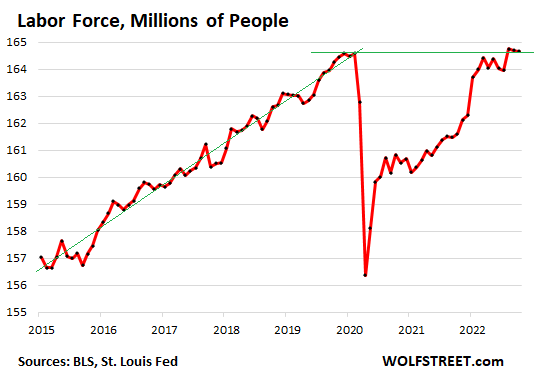
The overall labor force refuses to recover.
The labor force – people who either have jobs or are actively looking for jobs – dipped again in October, to 164.7 million people, according to the BLS today, based on its survey of households. It remains stunningly far below pre-pandemic trend.
This refusal – I use the term loosely here – of the labor force to get back to trend is the biggest issue the labor market has, and it’s a very complex issue, and lots of people are coming up with reasons for that. But it is what it is:
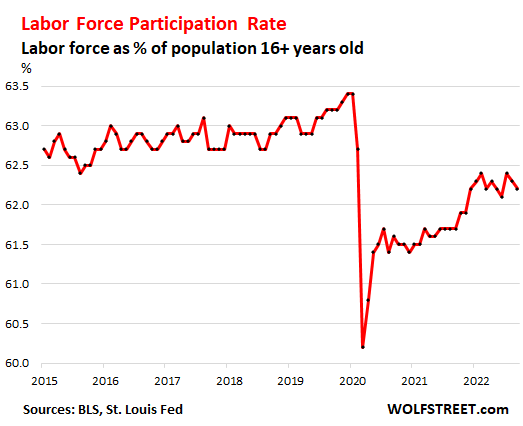
The labor force participation rate – the above labor force as a percent of the working-age population 16 years and older – dipped for the second month in a row to 62.2%, same as in January. It hasn’t improved at all this year:
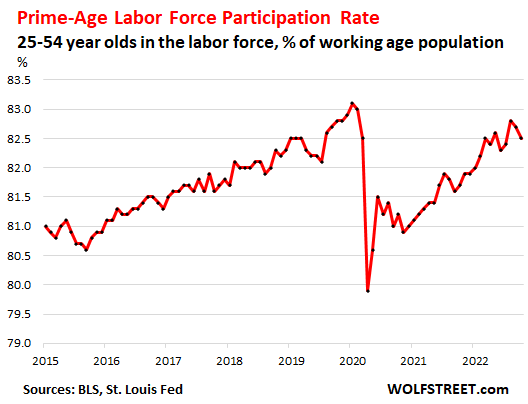
The prime-age labor force participation rate – people between 25 and 54 years old, which eliminates the effects retiring boomers have on the labor force — recovered a little more than the overall labor force participation rate, but also remains far below February 2020. In October, it dipped for the second month in a row, to 82.5%:
The working people.
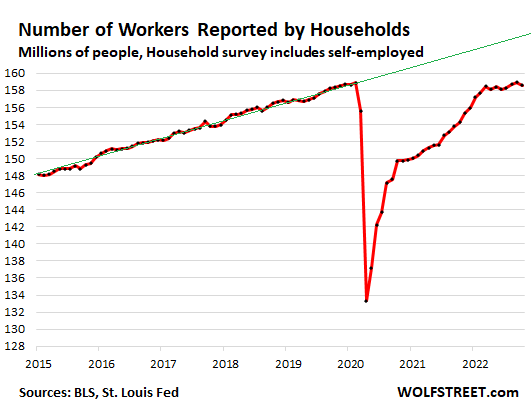
The overall number of people who are working has stagnated all year. This includes people with all kinds of work, gig workers, entrepreneurs, the self-employed, people with regular jobs, etc. The BLS obtains this data via large surveys of households. It’s the broadest employment measure and is very different from the “jobs created” data that the BLS obtains via large surveys from employers; more on that in a moment.
In October, the total number of working people dipped by 328,000 to 158.6 million. It has been essentially flat since December and remains below the February 2020 high.
So the same households that said that the number of unemployed people in their households were near historic lows also show that the number of working people hasn’t risen since December and remains below February 2020. The green line denotes the pre-pandemic trend.
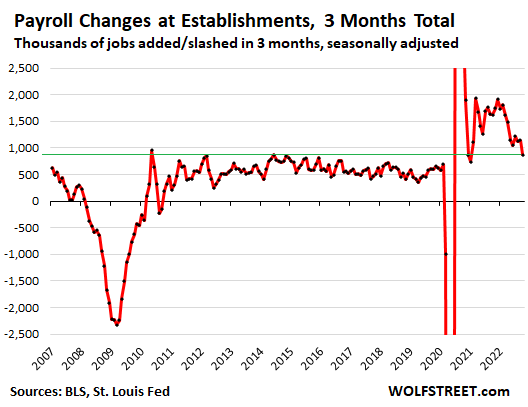
But employers added 261,000 workers to their payrolls in October. Over the past three months, they added 868,000 workers. So far this year, they added 4.07 million workers, according to surveys of employers by the BLS today. These are W-2 type employees, not gig workers and self-employed.
Over the summer, employers’ payrolls surpassed the pre-pandemic peak of February 2020 and have kept rising.
This continued relatively strong increase in W-2 type payrolls at employers has occurred even as:
- The labor force has gone nowhere
- The labor force participation rate has gone nowhere
- The total number of working people has gone nowhere.
This chart shows the rolling three-month total of changes in payrolls at employers. The latest three-month period from August through October came to 868,000 — the lowest since the reopening phase, but still higher than most pre-pandemic periods:
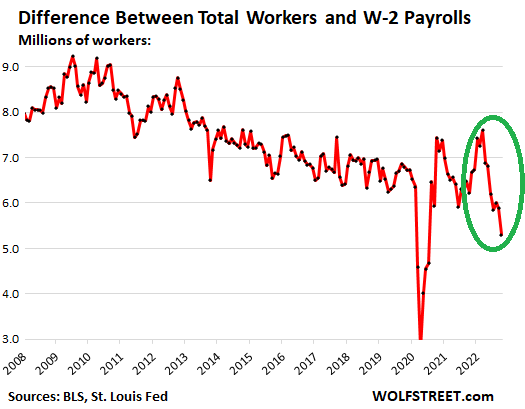
The self-employed switch to W-2 payrolls. The stagnation in the total number of working people (from the household survey) and the continued strong growth of W-2 payrolls at employers (from the establishment survey) shows that employers are aggressively hiring and offering wages and benefits that draw gig workers and the self-employed people onto their payrolls – and that makes sense.
This is a big shift: While employers created several million W-2 jobs this year, the total number of working people has remained the same, and we can conclude that a large number of gig workers and self-employed have joined the W-2 payroll crowd.
The chart below shows the trend. The total number of workers, as per household survey is always larger than the payrolls alone because the workers reflected in the household survey includes the W-2 employees plus all the rest of the workers. Since early 2022, that difference has been shrinking dramatically, from about 7.5 million workers in January, February, and March to just 5.3 million in October.
Unmet demand for labor.
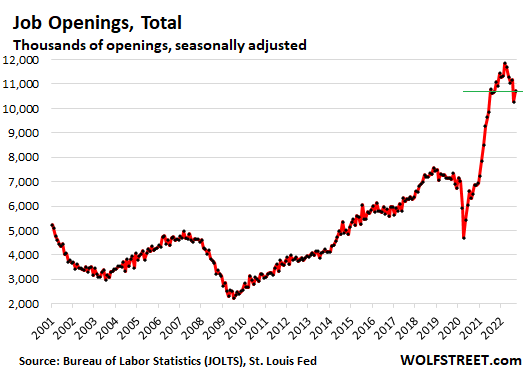
Job openings were up by 51% from September 2019, at an astronomical 10.7 million. We got this data a few days ago from the Job Openings and Labor Turnover Survey (JOLTS) by the BLS. In manufacturing, the number of unfilled openings was up by 84% from three years ago!
What gives?
The explosion of job openings last year, and the still huge unmet demand for labor depicted by these job openings currently, along with the very tight supply of labor, as seen by the labor force data, speak of the supply-and-demand imbalances currently in the labor market.
We can see the effects of aggressive hiring – such as offering higher wages, better benefits, improved working conditions – which turns into poaching workers from other employers, which creates that massive churn in the labor market that we can see in the historic number of workers who voluntarily quit their jobs because then can get a better job.
And this aggressive hiring also brings the self-employed onto the formal payrolls, as we’ve seen in the chart above.
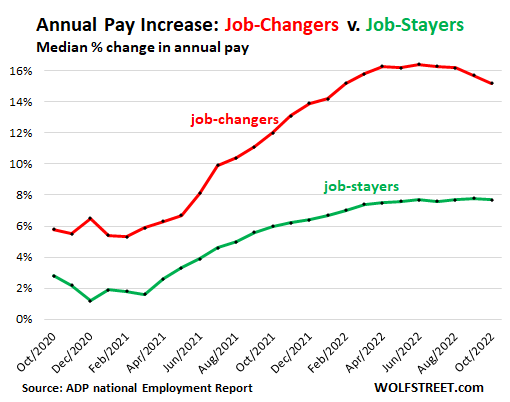
And the payroll data from ADP showed just how huge the wage gains were for people who quit their job to get a better job. For overall private-sector employees, the median annual increase in pay amounted to 7.7% for the “job-stayers” and to 15.2% for the job-changers:
Did this labor supply force employers to learn a lesson?
There is now mounting anecdotal evidence that many employers are having second thoughts about laying off people at the first signs they see their revenue growth get into trouble.
During the pandemic, they were very quick dumping millions of employees. But then starting last year, when business began to boom, they had a hard time hiring people back, and they had this massive number of unfilled job openings, and they were left short-handed, and they couldn’t expand their business as they’d wanted to, and they had to offer much higher wages to attract people to fill the slots they’d created by laying people off, and they had to hire people with less experience than what they had in those slots before, and it hit labor productivity.
It makes sense that employers that have the financial resources would hang on to their employees. We’re not talking about the cash-burn machines that sprang up willy-nilly over the past 10 years during the free-money era that are now facing an existential crisis, but companies with solid business models that see a potential recession on the horizon but are reluctant to lay off people, knowing that the labor market has changed structurally, and that they will have one heck of a time bringing people back on board afterwards. And that would be a good thing for the workers, and for the economy.
Enjoy reading WOLF STREET and want to support it? Using ad blockers – I totally get why – but want to support the site? You can donate. I appreciate it immensely. Click on the beer and iced-tea mug to find out how:

Would you like to be notified via email when WOLF STREET publishes a new article? Sign up here.
![]()
[ad_2]
Source link

German bond yields rise after Schnabel fuels inflation worries

Global economy headed for pervasive slowdown amid energy, inflation crises: OECD