The Most Splendid Housing Bubbles in Canada, November Update: Fastest 5-Month Plunge on Record
Down faster during the bust than up during the bubble: special feature in some cities. Vague humor wafts around the charts.
By Wolf Richter for WOLF STREET.
The overall 11-City Teranet-National Bank House Price Index dropped 0.8% in October from September, and is down 7.7% from the peak in May, the largest five-month drop in the history of the data going back to 1997. It slashed the year-over-year gain to 4.9%, from the 19% range in March and April.
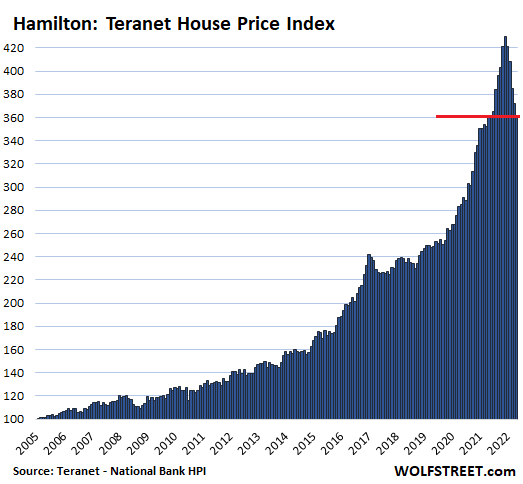
Nine of the 11 cities in the index had month-to-month drops in October, topped by a 5.7% plunge in Halifax. In Hamilton, prices have plunged by 15.9% from the peak in May after a ridiculous spike, and are now about flat year-over-year. Only two cities in the index had month-to-month gains: the oil towns of Calgary and Edmonton, whose housing markets had been asleep for 15 years.
Hamilton, where prices tend to move in parallel with Toronto, had become the #1 All Time Ever Most Splendid Housing Bubble in Canada after surpassing Toronto and Vancouver in 2021, as measured by the Teranet-National Bank House Price Index.
And it’s now #1 in terms of the percentage drop from peak. In October: -2.9% for the month, -15.9% from peak in May; about flat year-over-year.
Going down faster than up: The index plunged faster over the first five months of the bust (-69 points) than it had spiked over the last five months of the bubble (+65 points).
Vague humor wafts around these kinds of ridiculous price spikes that then unwind. This stuff make you wonder about the functioning of the human brain:
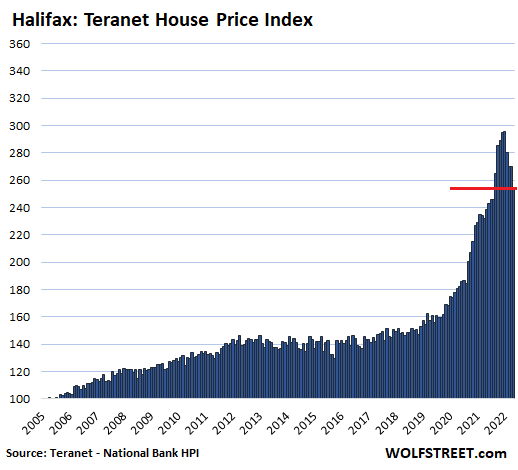
Halifax is #2 in terms of the drop from peak. In October: -5.7% for the month; -14.0% from the peak in June, which slashed the year-over-year gain to +6.7%, down from over 35% in early 2022.
Here too, the index plunged faster in the first four months of the bust (-41 points) than it had spiked during the last four months of the bubble (+31 points).
This chart proves once and for all that central-bank interest rate repression and QE – the entire free-money era – spawned a virus that turned the human brain to mush, a phenomenon that I previously observed with my Imploded Stocks. And then, when central banks end the free-money era, the brain begins to heal, and look what happens.
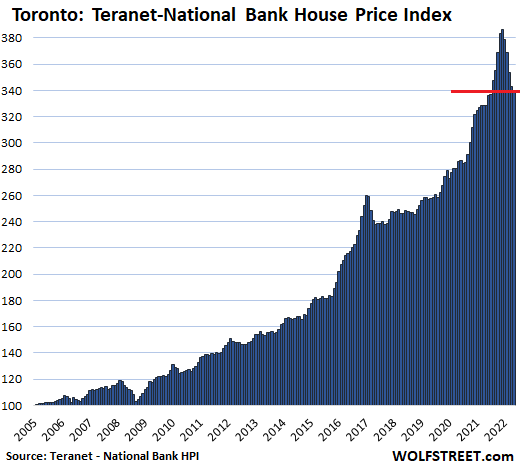
The Greater Toronto Area is #3 in terms of the drop from peak. In October: -0.9% for the month, -11.9% from the peak in May, slashing the year-over-year gain to 3.6%.
The index fell at nearly the same pace over the first five months of the bust than it jumped over the last five months of the bubble:
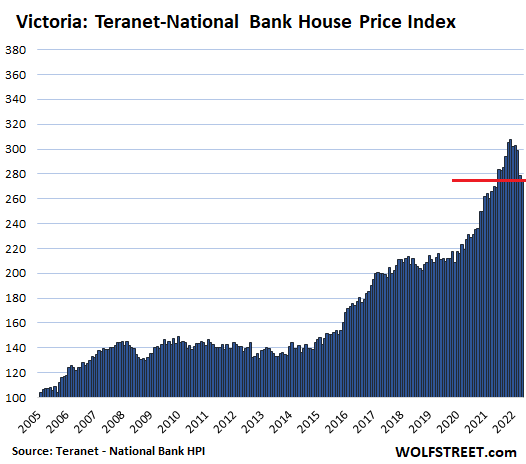
Victoria is #4 in terms of the drop from peak. In October: -1.2% for the month; -10.4% from the peak in May, which slashed the year-over-year gain to 2.1%.
The index plunged faster over the first five months of the bust (-32 points) than it had spiked over the last five months of the bubble (+24%):
Canada’s house prices reacted faster to rising interest rates than US house prices – though they’re now reacting too – largely because in Canada, most mortgages are either variable-rate with all kinds of guardrails or fixed-rate for terms such as two years or five years. So when interest rates began to surge, existing homeowners started to face the prospect of higher mortgage payments in the future. This is in addition to potential home buyers looking at mortgage payments at these rates and prices that they cannot afford.
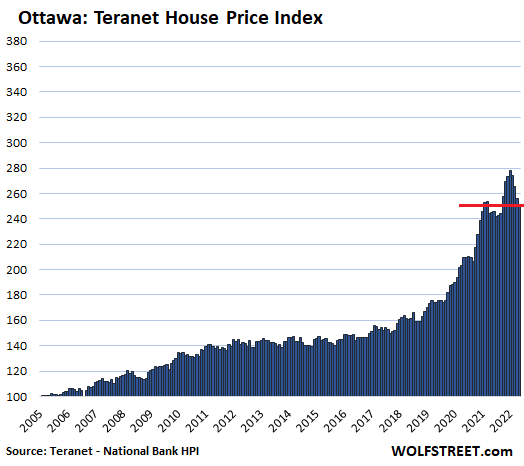
The methodology of the Teranet-National Bank House Price Index is based on “repeat sales” that tracks the price of the same home each time it is sold over time. Unlike median prices, the “repeat sales” method is not impacted by a shift in mix of the homes that sold. The index was set at 100 in June 2005 for all cities. My charts here are all on the same scale.
Ottawa is #5 in terms of the drop from peak. In October: -1.8% for the month; -9.6% from the peak in June, which slashed the year-over-year gain to 2.8%. The index is now below where it had first been in July 2021.
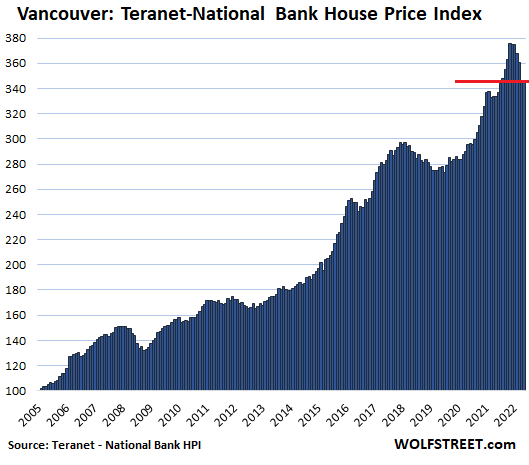
Greater Vancouver is #6 in terms of the drop from peak. In October: -0.1% for the month; -7.9% from the peak in April, which cut the year-over-year gain to 3.7%.
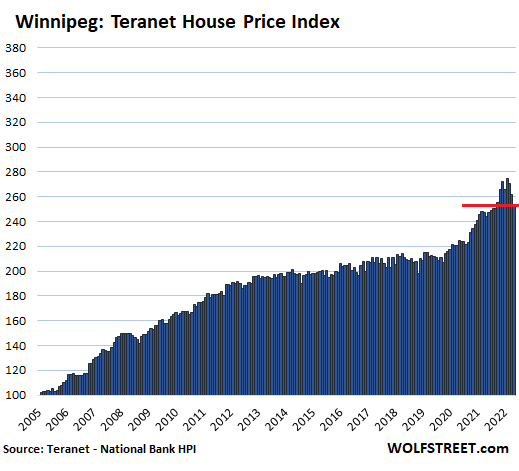
Winnipeg is #7 in terms of the drop from peak. In October: -3.1% for the month; -7.5% from the peak in June, which cut the year-over-year gain to 3.9%.
Down faster than up: The index dropped faster during the first four months of the bust (-21 points) than it had spiked during the last four months of the bubble (+19 points).
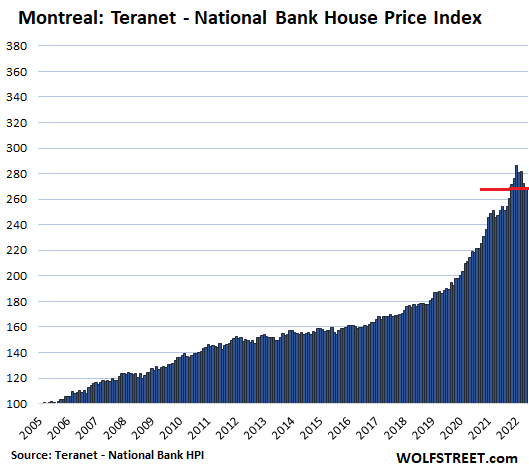
Montreal, in October: -1.5% for the month; -6.4% from the peak in June, which cut the year-over-year gain to 8.4%:
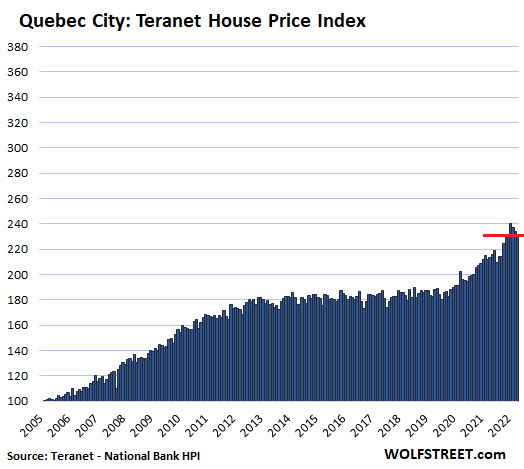
Quebec City, in October: -1.2% for the month; -3.6% from the peak in July, which cut the year-over-year gain to 8.6%:
The Oil Towns are still the exception.
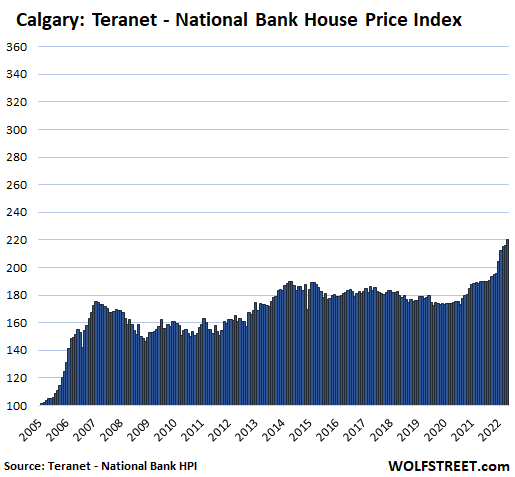
In Calgary, oil capital of Canada, in October: +2.0% for the month to a new record; +16.2% year-over-year. Prices had been roughly flat from mid-2007 until mid-2020:
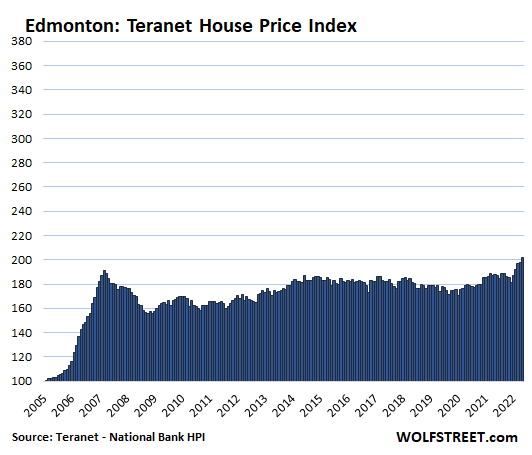
In Edmonton, also in Canada’s oil patch, in October: +2.1% for the month to a new record; +7.5% year-over-year. The index is now just a hair above where it had been in mid-2007:
Enjoy reading WOLF STREET and want to support it? You can donate. I appreciate it immensely. Click on the beer and iced-tea mug to find out how:

Would you like to be notified via email when WOLF STREET publishes a new article? Sign up here.
![]()
[ad_2]
Source link

Silver Demand Projected to Set Records in 2022 and Other Silver News
How the Massive Gains in Average Hourly Wages Look Ludicrous Compared to the Reality of Spiking Prices