Will stagflation push bullion to fresh all-time highs?

Gold awaits a Fed pivot for rocketing in 2023
With a largely flat performance in 2022 but fluctuating within a large 20% range, gold has had a wild year so far.
Following the outbreak of the Ukrainian conflict in early March, the precious metal climbed to $2,070/oz, nearing the all-time highs recorded in August 2020. However, after peaking, gold prices fell 22% to $1,615/oz. The primary factor weighing on gold was, of course, the extraordinarily hawkish Federal Reserve, which raised interest rates by a total of 425 basis points from March to December, delivering the quickest rate rise cycle ever.
Gold prices suffered as the US dollar (DXY) strengthened and US Treasury yields rose. In addition, continuous Covid lockdowns in China hindered jewellery demand from one of the world’s largest consumers of precious metals.
After reaching a “triple low” on September 29, October 21, and November 3, gold witnessed a 13% rally until the end of the year, supported by lower-than-anticipated US CPI prints that fueled speculations on a Fed pivot in the next year.
Gold is trading at a premium to its long-term historical association with 10-year US real rates. Gold and the US dollar continue to have a strong negative correlation.In November, large money managers went from net-short to net-long positioning on gold’s futures, thus turning more optimistic.
The best-case scenario for gold in 2023 involves a global slowdown and a shift by central banks toward looser financial conditions, particularly in the United States. A reopening in China may also have a beneficial effect on the bullion market. These events might boost gold prices by at least 10% to $2,000/oz.
If stagflation were to worsen, with a global recession and stickier-than-predicted inflation but central banks holding back further monetary tightening, gold’s price might rise exponentially as investors flee bonds, equities, and currencies all at once, as happened in the 1970s. In this situation, gold would be seen as the “only asset in town” and may be on track to surpass its all-time high of $2,075/oz.
Gold’s worst-case scenario for 2023 is a Fed that defies dovish market expectations, hikes more than expected, and doesn’t ease monetary conditions if a recession occurs. However, the onset of a recession might gradually reduce the negative impact of elevated interest rates, implying that gold may suffer less than it did during the selloff in 2022.
Chart 1: Price action of gold in 2022
What is your sentiment on Gold?
Vote to see Traders sentiment!
 Gold daily chart as of December 21, 2022 – Chart: Capital.com, Source: Tradingview
2022 Year in review for the gold and metal market
Gold saw a 16% strong surge between the end of January 2022 and the 8th of March 2022, attempting to reach its prior all-time high of $2075/oz achieved in August 2020, as the war in Ukraine led to an increase in geopolitical tensions and market risk aversion.
As the Fed delivered its first interest rate rise of the year in mid-March 2022, gold began to flex lower. When Fed Chair Jerome Powell started to accelerate the pace of hikes the negative trend in gold prices intensified over the summer and until the conclusion of Q3. Gold fell 22% from March peaks to September lows at 1,615/oz amid a dollar rally and rising Treasury yields,
Gold began to recover by 12% by the end of December after hitting what is known as a technical “triple bottom” in the months of September, October, and November.
In comparison to the performance of other major metals in 2022, gold had a mixed year overall. The yellow metal outperformed copper (-14%) and palladium (-4.2%), but lagged behind silver (+4.5%) and platinum (+4.6%).
Chart 2: Performance of major metal commodities in 2022
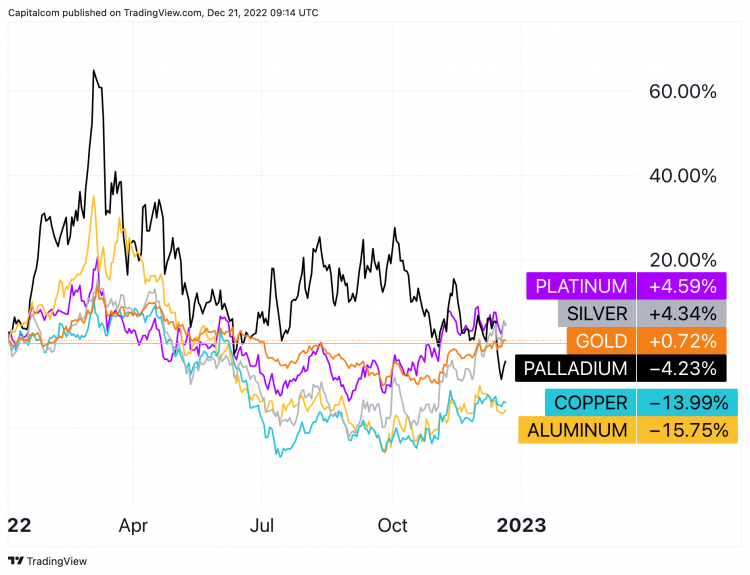 Gold, silver, copper, platinum, palladium, and aluminium ytd performance as of December 21, 2022 – Chart: Capital.com, Source: Tradingview
Gold vs US 10-year real yields: Expensive valuations or decoupling?
Gold is trading at a wide price premium when compared to the historical long-term correlation of the bullion with US 10-year real yields.
After the Fed fiercely raised interest rates in 2022, real yields on 10-year Treasuries – measures the difference between nominal rates and breakeven inflation rates – moved from negative to positive territory.
Higher real yields on a safe-haven asset like the U.S. Treasury bond, decrease the incentive to hold or buy a non-yielding asset, such as gold.
However, the negative impact to gold prices from rising US real rates was less severe than expected given the adverse historical link between the two variables.
During times of positive real yields, gold has consistently traded below $1,450 per ounce. Real rates are currently hovering around 1.5%, while gold is trading at over $1,800 per ounce, suggesting that the historical association between the two seems to have broken in 2022.
Chart 3: Gold vs US 10-year real yields
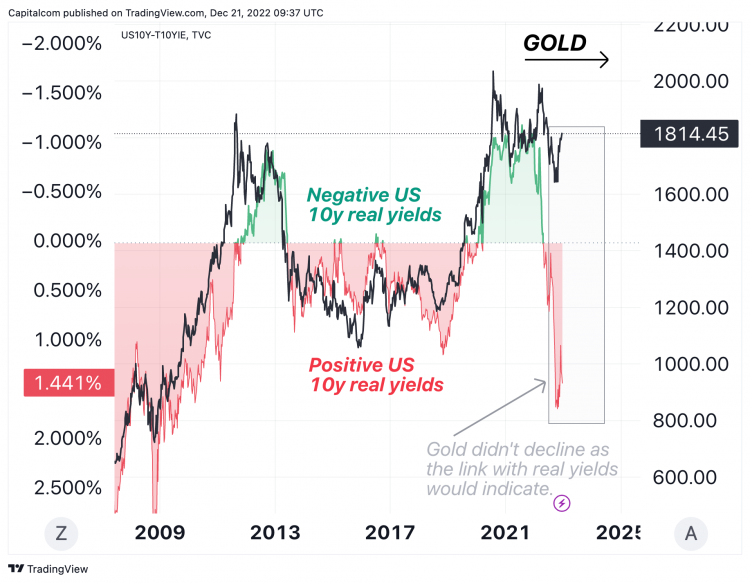 The longstanding negative link between gold and US real rates broke in 2022 – Chart: Capital.com, Source: Tradingview
How will the gold-dollar correlation evolve in 2023?
Since the start of the Fed’s hike cycle, the negative link between gold and the US dollar has become stronger. The strengthening of the dollar weighed significantly on gold prices in Q2 and Q3, but when the USD weakened in Q4, bullion rallied.
The 30-day correlation coefficient between gold and the US dollar index (DXY) now stands at -0.87, implying almost a perfect negative linear link between the two.
This dollar-gold relationship may remain strong in 2023. If the dollar weakens as anticipation of a Fed turn increases, gold may appreciate higher. On the other side, if the Federal Reserve maintains its hawkish stance for an extended period of time, this will lend support to the dollar and put pressure on gold.
The outlook for US GDP and inflation are the main factors that should be considered when analysing the dynamics of the gold-dollar correlation. An economic slowdown and lower inflation would put less pressure on the Fed to remain hawkish, benefiting gold. In contrast, if the US economy avoids a recession and the labour market remains exceptionally tight, the US central bank may remain solely focused on bringing inflation back to the 2% objective.
Chart 4: Gold-dollar correlation in 2022
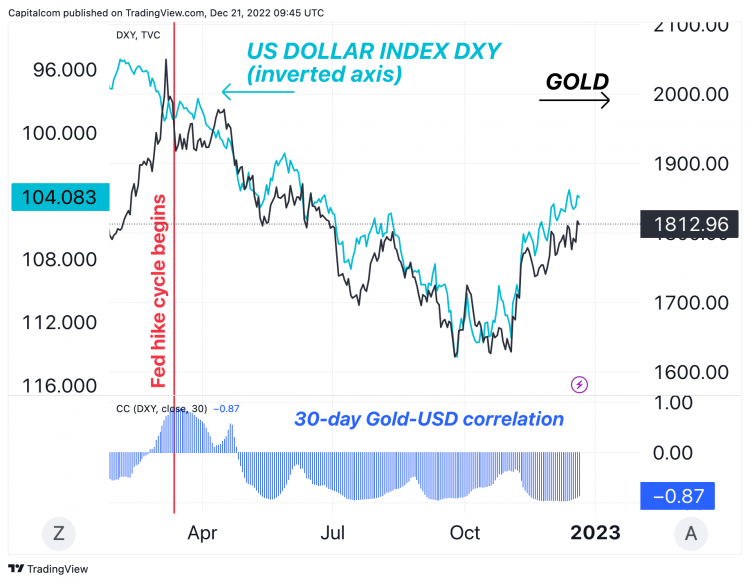 Gold vs US dollar price actions and correlation in 2022 – Chart: Capital.com, Source: Tradingview
Gold commitment of traders (COT): Money managers turn net long
Large money managers’ stance toward gold has recently improved, with the net holding of futures and options contracts turning positive.
According to the Commodity Futures Trading Commission’s (CFTC) weekly Commitments of Traders (COT) report, money managers’ net holdings of COMEX gold options and futures were equivalent to 56,554 contracts for the week ending December 13th 2022, the highest level since late June 2022.
Money managers’ long positions in gold options and futures have a positive effect on the metal’s spot price.
Therefore, increased net long positions on gold derivative contracts will likely continue to put upward pressure on spot prices in the next year.
Chart 5: Gold and commitments of traders
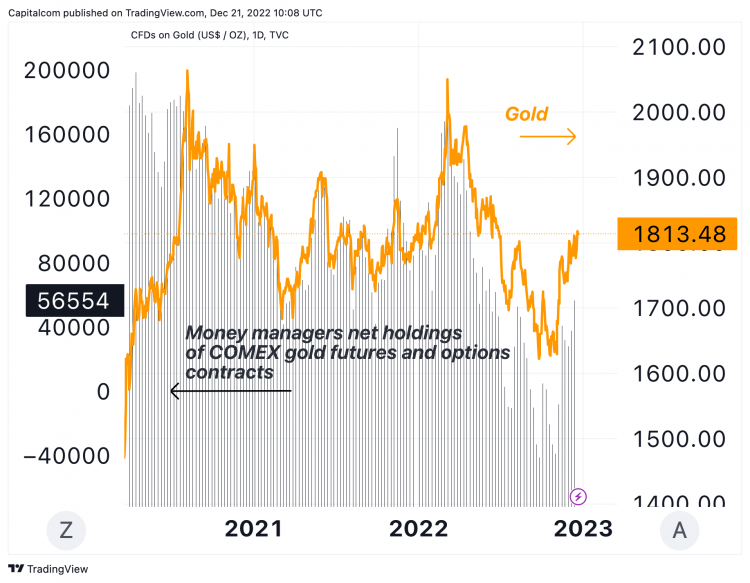 Gold price vs COT (Money Managers) – Chart: Capital.com, Source: Tradinview
The bullish scenario for gold in 2023
The best-case scenario for gold in 2023 entails a slowdown in global economic activity and a shift by the world’s central banks toward looser financial conditions amid reducing fears of inflation.
If the US economy goes into a recession and inflation continues to slow down, a rising unemployment rate would put the Federal Reserve in a difficult position to keep a hawkish stance. A dovish shift by the Fed board would negatively affect the dollar and thus drive gold prices higher.
A successful reopening in China may also have a positive impact on physical demand for jewellery gold. If these catalysts materialize, gold prices might rise by at least 10% to around $2,000/oz.
If stagflation were to intensify, with a worldwide recession and sticky inflation, but with central banks holding off on additional monetary tightening, gold’s price might skyrocket as investors exit bonds, stocks, and currencies simultaneously. A similar extremely bullish scenario played out in the 1970s. In this case, gold would be viewed as the “only asset in town,” and it may exceed its all-time high of $2,075/oz.
The bearish scenario for gold in 2023
If inflation is a difficult beast to defeat, the economy holds up rather well despite tighter financial conditions, and the job market remains exceptionally tight, central banks may even hike more than the market anticipated.
This would result in “more of the same” downward pressure on gold prices, as investors will perceive the dollar as the best inflation hedge.
However, the onset of a recession next year may progressively lessen the negative impact of high US interest rates, suggesting that gold may suffer less than it did during the selloff in 2022. Overall, in a gloomy scenario with a hawkish Fed and a US slowdown, gold might average around $1,675-1,700/oz.
Gold chart analysis: 1,840 is the key level to watch
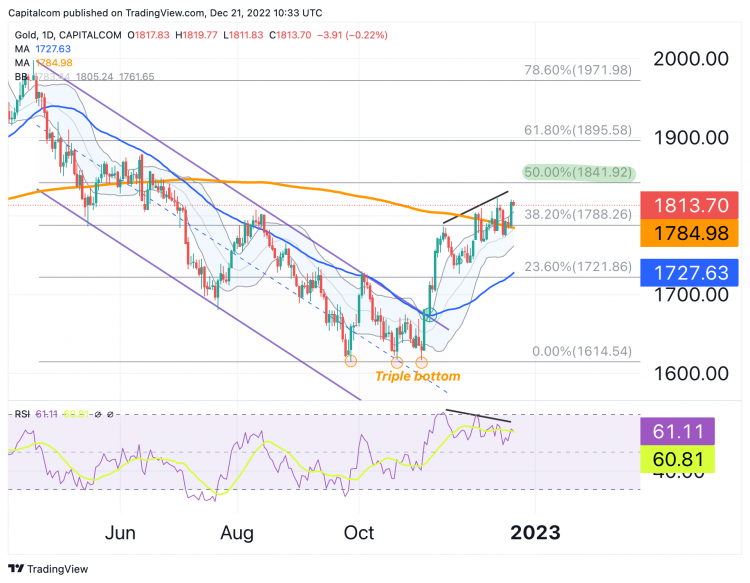 Gold daily chart as of December 21, 2022 – Chart: Capital.com, Source: Tradingview
Gold prices soared after reaching a triple bottom on November 3rd, breaking some important price resistances along the way.
The bullion first breached the 50-day moving average at 1,675, which also corresponded with the descending channel in 2022, and then the 200-day moving average in December, hanging around 1,800.
As of this writing, gold prices have successfully retraced slightly more than 38.2% of the 2022 high-to-low range. The next key Fibonacci level stands at 50% retracement, which lies around 1,841.
This will be a critical hurdle for gold to overcome since it marks the support zone before to the Q3 2022 selloff. If bulls prevail over bearish resistance there, they may have enough confidence to push prices higher to 1,895 (61.8% Fibonacci) and then to 1,971 (78.6% Fibonacci).
If gold prices instead encounter resistance at 1,841 and then pullback, it will be a bullish letdown that might lead to more downside pressure.
If a bearish RSI divergence forms, the pressure from sellers may increase. Gold prices are higher than mid-November, but the momentum oscillator is falling.
If this scenario plays out, the initial support level would be 1,788-84 (38.2% Fibonacci and 200-dma), followed by 1,727-21 (23.6% Fibonacci and 50dma).
Will gold prices go up or down in 2023?
Following a tumultuous 2022, gold prices are projected to benefit from a probable economic slowdown in 2023, which may cause global central banks to become less hawkish. A weaker US dollar and a reopening in China would also be supporting factors for the bullion. In the bullish scenario, gold may have a 10% upside in 2023. However, if global central banks tighten policy further and a recession is avoided, gold would receive headwinds from higher interest rates and stronger USD.
Can gold reach its all-time highs in 2023?
For gold to surpass its all-time highs of $2,075/oz in 2023, a Fed dovish turn must occur as a result of a severe recession and despite inflation remaining higher than the target. Gold may be viewed as the best hedge against stagflation in this instance.
Can gold go below $1,615/oz in 2023?
Gold sliding to 2022 lows around 1,615 demands a more hawkish Federal Reserve, which would boost the dollar and real rates. The advent of a recession, however, due to tighter financial conditions, may imply that gold could likely suffer less than it did in 2022.
Related reading
Rate this article
[ad_2]
Source link

A bipartisan group of Senators is talking about raising the retirement age on Social Security

Silver is outperforming gold this month, and that’s just the start

Comments
There are currently no responses for this story.
Be the first to respond.