The Most Splendid Housing Bubbles in America, December Update: Now Dallas, Las Vegas, Phoenix Plunge Fastest. San Francisco, Seattle, San Diego Down Most from Peak
No dear, this is not seasonal.
By Wolf Richter for WOLF STREET.
Declines in house prices have turned into a relentless drumbeat. Today, the S&P CoreLogic Case-Shiller Home Price Index for “October” was released. Time frame: A three-month moving average of closed home sales that were entered into public records in August, September, and October; these are deals that were largely made in July through September.
Since then, home prices have dropped further nationwide, as we know from different median-price indices; for example, in the city of San Francisco, the median house price has now plunged by 27% from the peak in April.
The Case-Shiller Index here – it covers 20 metropolitan areas – is a more reliable indicator than the sometimes-crazy median-price indices that can be heavily skewed by a change in the mix of homes that are sold. But the Case-Shiller index lags months behind.
On a month-to-month basis, house prices dropped again in all 20 metros that are in the Case-Shiller Index. On a year-over-year basis, the price gains were further slashed, with the condo index for San Francisco now negative; and the house price index just about flat.
The biggest month-to-month drops in today’s “October” index occurred in:
- Dallas: -2.1%
- Las Vegas: -1.8%
- San Francisco: -1.7%
- Phoenix: -1.6%
- Denver: -1.1%
- Seattle: -1.0%
- Boston: -1.0%
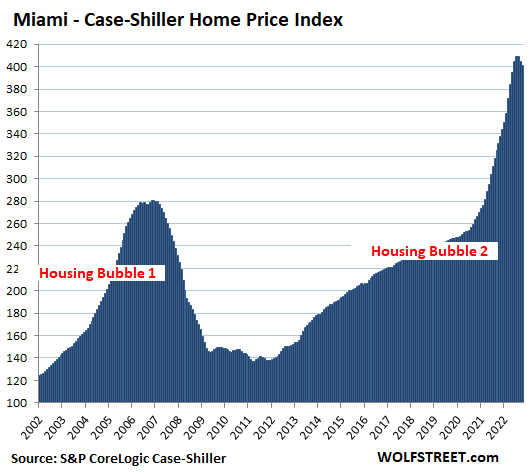
- Miami: -1.0%
From their various peaks, which range from May to July, house prices dropped the most in:
- San Francisco Bay Area: -13.0%
- Seattle metro: -12.2%
- San Diego metro: -8.5%
- Denver metro: -6.7%
- Los Angeles metro: -6.6%
- Phoenix metro: -5.9%
- Dallas metro: -5.6%
- Las Vegas metro: -5.2%.
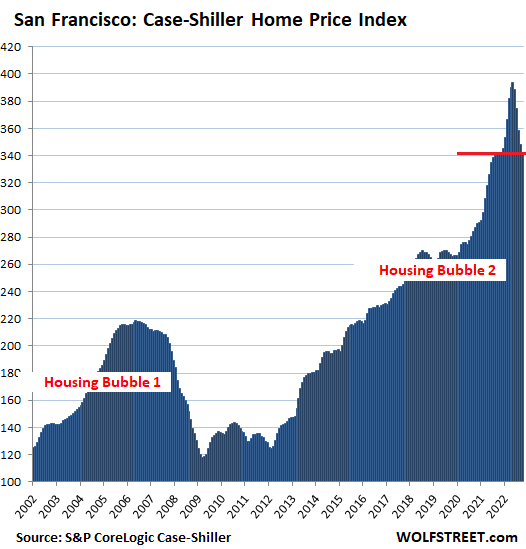
In the San Francisco Bay Area, house prices dropped by 1.7% in “October” (three month moving average of sales that were entered into public records in August, September, and October), and are now down by 13.0% from the peak in May.
Plunging faster than it had spiked: Over those five months since the peak, the index plunged by 51.4 points. Over the five months to the peak, it had spiked by 48.6 points.
The five monthly drops from the peak have nearly wiped out the year-over-year gain (+0.6%). The Case-Shiller Index for San Francisco Bay Area condos is already down by 1.3% year-over-year.
The index for “San Francisco” covers five counties of the nine-county San Francisco Bay Area: San Francisco, part of Silicon Valley, part of the East Bay, and part of the North Bay.
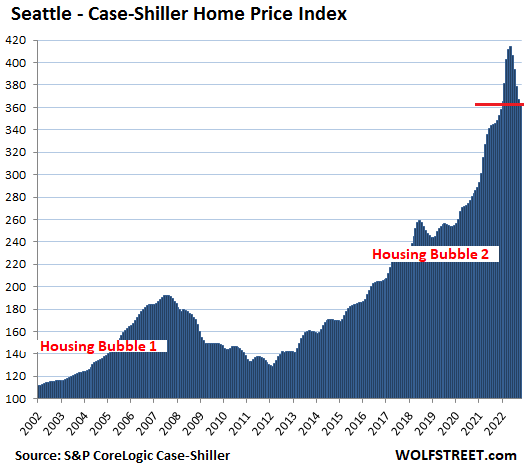
In the Seattle metro, house prices dropped 1.0% in October from September, and are now down 12.2% from the peak in May.
Over those five months since the peak, the index plunged by 50.4 points. Over the five months to the peak, it had spiked by 55.9 points.
These five months of price drops slashed the year-over-year gain to 4.5%.
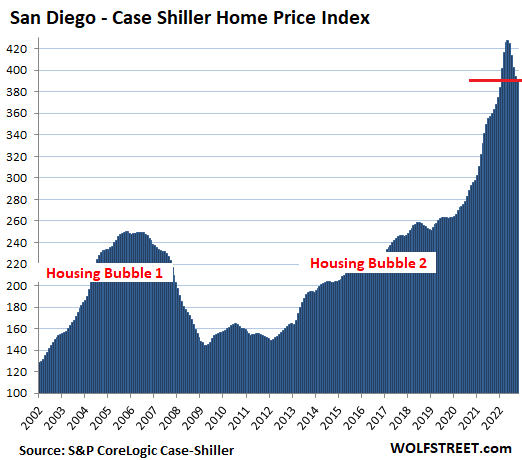
San Diego metro:
- Month over month: -0.7%.
- From the peak in May: -8.5%.
- Year over year: +7.5%.
- Down in five months from peak in May: -36.5 points
- Up in five months to peak in May: 53.4 points.
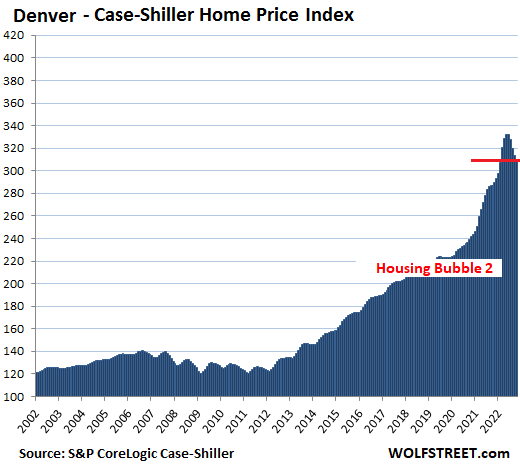
Denver metro:
- Month over month: -1.1%.
- From the peak in May: -6.7%.
- Year over year: +7.9%.
- Down in five months from peak in May: -22.2 points
- Up in five months to peak in May: +39.3 points.
Los Angeles metro:
- Month over month: -0.6%.
- From the peak in May: -6.6%.
- Year over year: +6.6%.
- Down in five months from peak in May: -27.8 points
- Up in five months to peak in May: 44.3 points.
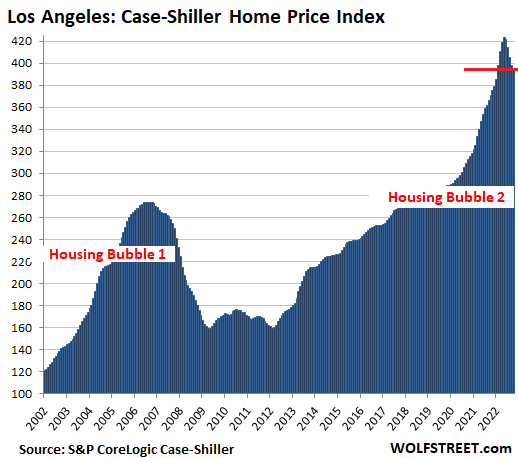
Changing leadership among the most splendid housing bubbles. For Los Angeles, the current index value of 395 means that home prices ballooned by 295% since January 2000, when the index was set at 100. Based on the increase since 2000, Los Angeles was the #1 Most Splendid Housing Bubble in America until February 2022, when it was bypassed by San Diego.
But both were bypassed by Miami in August 2022, as prices in Los Angeles and San Diego were plunging, while prices in Miami had just started to drop. So Miami has become the #1 Most Splendid Housing Bubble in America, with prices still up by 301% from January 2000. Now they’re all chasing each other down.
Methodology of the Case-Shiller Index: The index uses the “sales pairs” method, comparing sales in the current month to when the same houses sold previously. The price changes within each sales pair are integrated into the index for the metro, are weighted based on how long ago the prior sale occurred, and adjustments are made for home improvements and other factors (methodology).
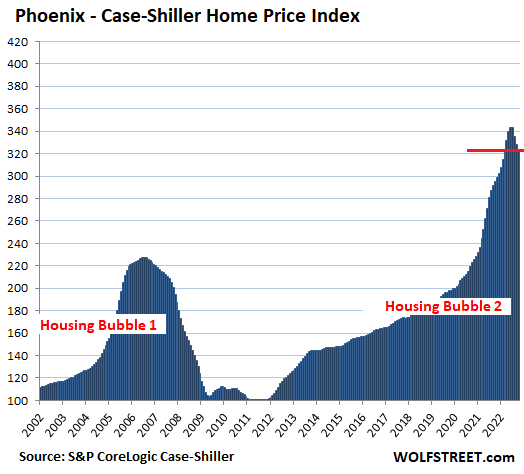
Phoenix metro:
- Month over month: -1.6%.
- From the peak in June: -5.9%.
- Year over year: +9.6%
- Down in four months from peak in June: -20.4 points
- Up in four months to peak in June: +29.2 points.
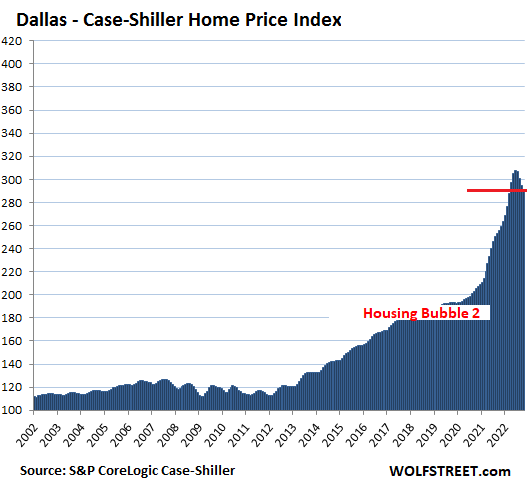
Dallas metro:
- Month over month: -2.1%.
- From the peak in June: -5.6%.
- Year over year: +13.5%
- Down in four months from peak in June: -10.3 points
- Up in four months to peak in June: +36.3 points.
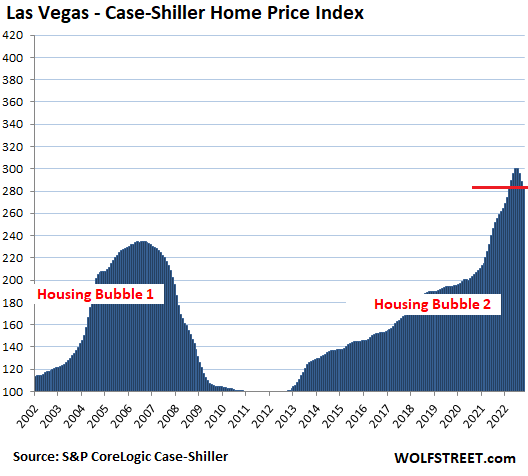
Las Vegas metro:
- Month over month: -1.8%.
- From the peak in July: -5.4%.
- Year over year: +9.4%
- Down in three months from peak in July: -16.3 points
- Up in three months to peak in July: +17.0 points.
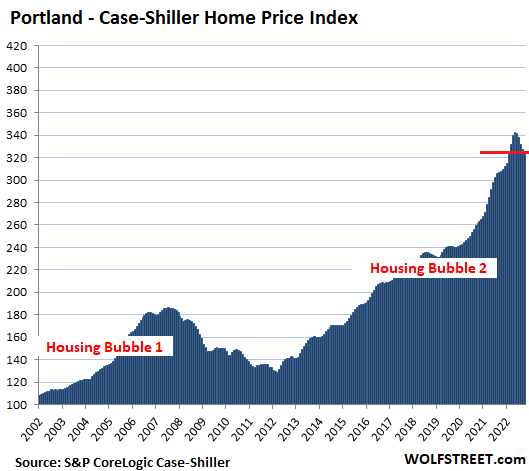
Portland metro:
- Month over month: -0.9%.
- From the peak in May: -5.2%.
- Year over year: +5.4%.
- Down in five months from peak in May: -17.7 points
- Up in five months to peak in May: +30.4 points.
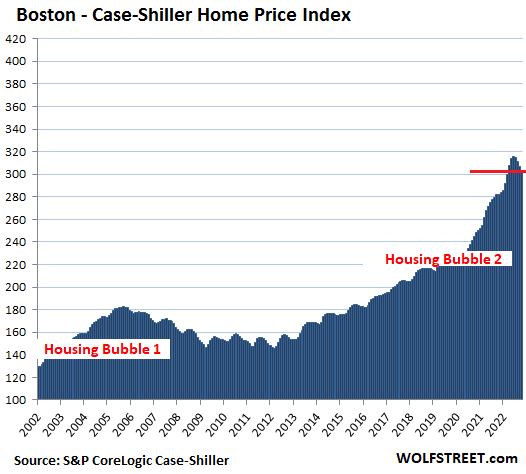
Boston metro:
- Month over month: -1.0%.
- From the peak in June: -4.0%.
- Year over year: +7.6%
- Down in four months from peak in June: -12.5 points
- Up in four months to peak in June: +24.2 points.
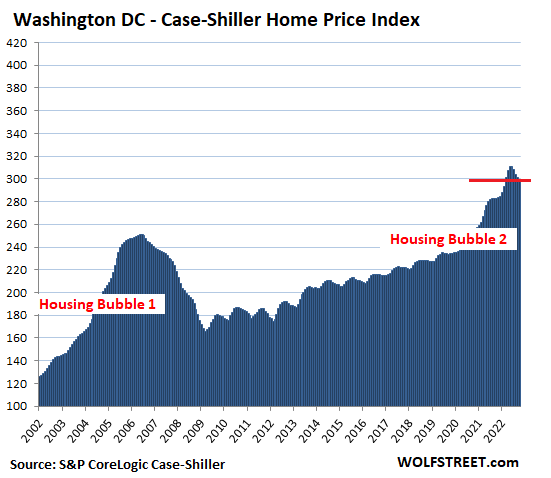
Washington D.C. metro:
- Month over month: -0.5%.
- From the peak in June: -3.6%.
- Year over year: +6.0%
- Down in four months from peak in June: -11.3 points
- Up in four months to peak in June: +17.5 points.
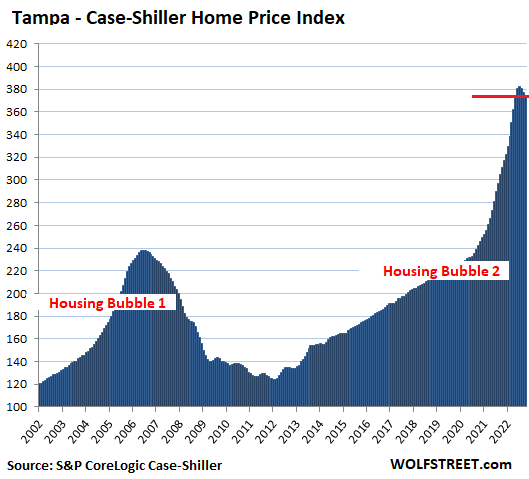
Tampa metro:
- Month over month: -0.8%.
- From peak in July: -2.1%
- Year over year: +20.5%
- Down in three months from peak in July: -8.0 points
- Up in three months to peak in July: +29.3 points.
Miami metro:
- Month over month: -1.0%.
- From peak in July: -2.1%
- Year over year: +21.0%
- Down in three months from peak in July: -8.6 points
- Up in three months to peak in July: +32.7 points.
In the New York metro:
- Month over month: -0.2%.
- From peak in July: -1.5%
- Year over year: +9.3%
- Down in three months from peak in July: -4.1 points
- Up in three months to peak in July: +12.0 points.
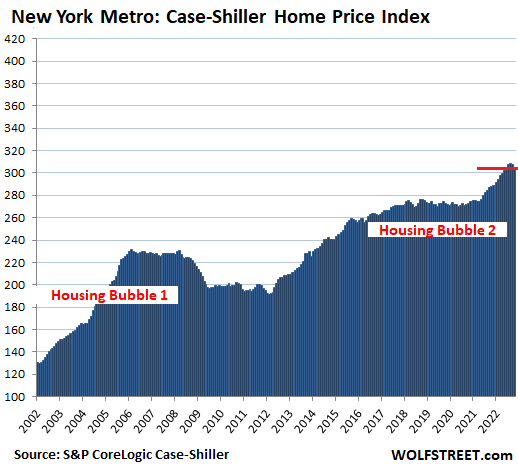
In the New York metro, house price inflation since 2000 amounted to 172%, based on the Case-Shiller Index value of 273 today. This makes it the taillight of the Most Splendid Housing Bubbles.
In the remaining six cities in the 20-City Case-Shiller Index, house price inflation has been less, and they don’t qualify for this roster. But they also experienced month-to-month declines in the “October” index, following the declines September: Chicago (-0.5%), Charlotte (-0.9%), Minneapolis (-0.7%), Atlanta (-0.8), Detroit (-0.9%), and Cleveland (-1.0%).
Enjoy reading WOLF STREET and want to support it? You can donate. I appreciate it immensely. Click on the beer and iced-tea mug to find out how:

Would you like to be notified via email when WOLF STREET publishes a new article? Sign up here.
![]()
[ad_2]
Source link
Strong Dollar At 20-Year High Creating Havoc

Fed’s Jay Powell refuses to rule out string of aggressive rate rises
