How the CPI “Weights” Changed and Moved CPI: Meet the Surprises
In numbers and charts: The weight changes in the major CPI categories pushed up overall CPI.
By Wolf Richter for WOLF STREET.
There has been a hullabaloo of sorts in certain circles recently about the adjustment of weights for the calculations of the Consumer Price Index (CPI) by the Bureau of Labor Statistics. Swirling around in this hullabaloo were suggestions that certainly the BLS is adjusting the weights to manipulate CPI down and further deceive Americans about inflation. So we’re going to look at the actual weights and numbers and charts, to see how the weights changed in recent years and for 2023. So meet the surprises.
There are about 330 expenditure categories of goods and services that make up CPI. For example, “white bread” is one category, summarizing the prices of many different types and brands of white bread. In this manner, the CPI basket covers just about everything consumers are buying. Each of these goods or services is assigned a weight in the overall index that determines its “relative importance” in the overall index. All goods and services added together have a weight of 100%. That never changes. What changes are the weights of the individual categories, some weights increasing, others decreasing, but the sum always = 100%.
The BLS adjusts these weights based on the changing purchasing patterns by consumers. When consumers spend a larger portion of their total spending on item X than they used to, the weight of Item X increases. Conversely, they will spend a smaller portion of their total spending on Item Y, and its weight is then reduced. The idea is to keep the CPI basket up-to-date with current consumer purchasing patterns, which shift over time.
These adjustments used to be made on a two-year cycle. Starting with 2023, the adjustments of the weights will be made every year to capture shifts in spending more quickly. During Covid, there were massive shifts in the spending patterns, causing mind-boggling distortions in the economy. But because the weight adjustments occurred on a two-year cycle, they initially missed the big changes. So going forward, the adjustments will be made annually, the BLS said.
Here are nine major categories that together account for 83% of overall CPI:
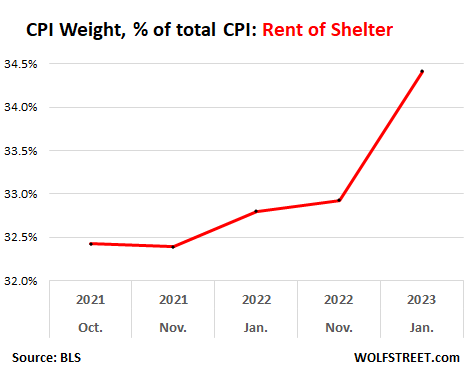
“Rent of shelter,” a high-inflation biggie: weight increased, pushed up CPI.
The weight of “rent of shelter” – a stand-in for housing costs that roughly accounts for one-third of CPI – was increased in 2022. Because the CPI for “rent of shelter” spiked in 2022, the higher weight made the overall CPI worse in 2022. It was then again increased by a much larger amount in January 2023 for the current year.
The weight was increased from 32.05% in November 2021 to 32.42% in January 2022, and to 34.04% in January 2023.
In January 2023, with the CPI for rent of shelter a red-hot +0.8% month-to-month and +8.0% year-over-year, the higher weight made CPI even worse:
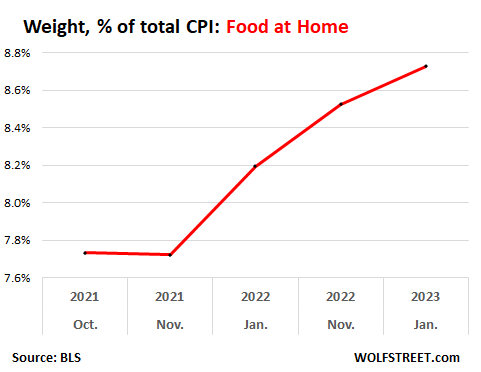
Food at home: weight increased, pushed up CPI.
The weight of food at home – food and beverages that folks buy at stores – jumped in 2022 with a surge in purchases in 2020 (remember, it was on a 2-year cycle). The weight has now jumped from 7.7% in November 2021 to 8.7% in January 2023.
The year-over-year CPI of food at home has been in the double digits for 10 months in a row. And the higher weights made CPI even worse so far:
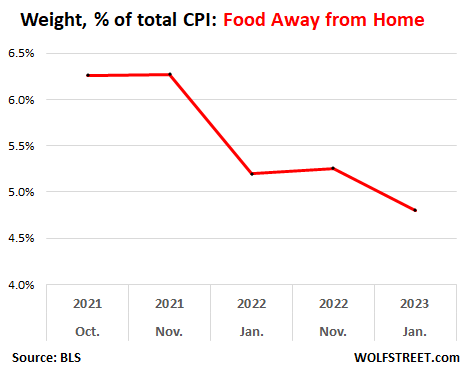
Food away from home: weight dropped, pushed down CPI.
Food away from home includes restaurants, delis, vending machines, cafeterias at schools, company work sites, etc. This industry got crushed during the pandemic. Restaurants have recovered, except those trying to make a living off the office lunch crowd; those got hammered by working from home, which also hammered company-provided meal services in office buildings that used to be touted as a big benefit. Many companies closed those eating facilities because people are working from home. So overall, people were eating more at home, and used the company-provided lunch and dinner facilities less often.
And the weight of food away from home dropped from 6.3% in November 2021 to 4.8% in January 2023, with the biggest drop occurring for 2022, and a smaller drop for 2023.
The CPI for food away from home has been running hot at over 8% for much of last year (in January 2023: +0.6% month-to-month and +8.2% year-over-year), and the decline in the weight pushed down overall CPI:
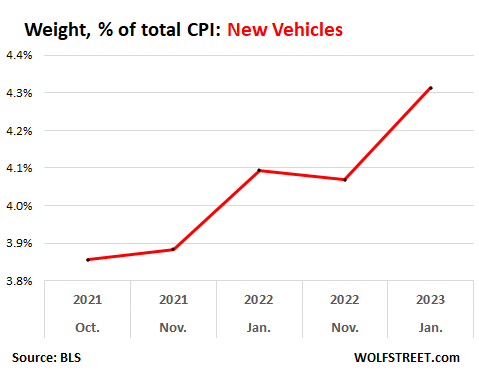
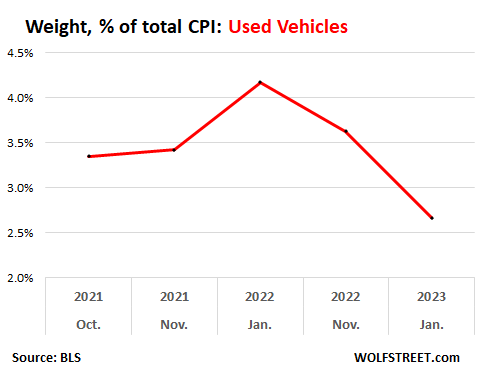
New and used vehicles: Weight changes pushed up CPI.
The number of new vehicles sold to end-users plunged in 2020, 2021, and 2022 to levels first seen in the 1970s due to supply-chain shortages, particularly semiconductor shortages. With inventories depleted, the prices of new vehicles shot higher, and month after month for 12 months straight, from October 2021 through September 2022, the CPI for new vehicles jumped by over 10% year-over-year.
The weight rose from 3.9% in November 2021 to 4.3% in January 2023, which, given the increase in new-vehicle CPI, made overall CPI worse.
Used vehicle sales volume dropped substantially from pre-pandemic levels, largely because of the most mind-boggling price spikes ever, with the CPI for used vehicles spiking by 45% year-over-year in the summer of 2021, and enough people just said no, and for the past 12 months, the CPI for used vehicles actually dropped.
Weights were adjusted higher in January 2022 to 4.2%, but then were reduced to 2.7% in January 2023. Because used vehicle prices have dropped for a whole year, the lower relative importance of the dropping CPI for used vehicles pushed up the overall CPI so far:
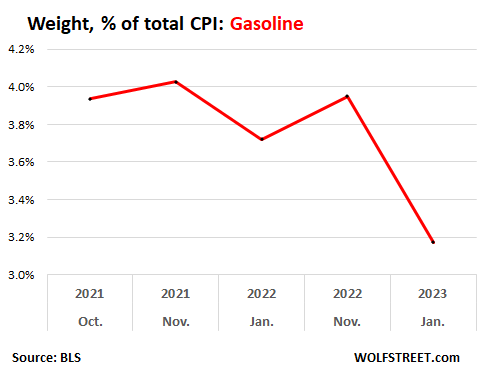
Gasoline: weight dropped, as consumption dropped.
Gasoline is one of those products that when the price spiked through mid-2022, people cut their consumption. According to EIA data, consumption of gasoline in the US, as measured in barrels per day, fell by 4.5% in 2022 from 2021.
Over the last six months of 2022, gasoline prices plunged. In January, the CPI for gasoline was just a tad higher than in January a year ago
The weight of gasoline dropped from 3.9% in November 2021 to 3.2% in January 2022. With little year-over-year price change in gasoline in January, overall CPI wasn’t impacted in a major way.
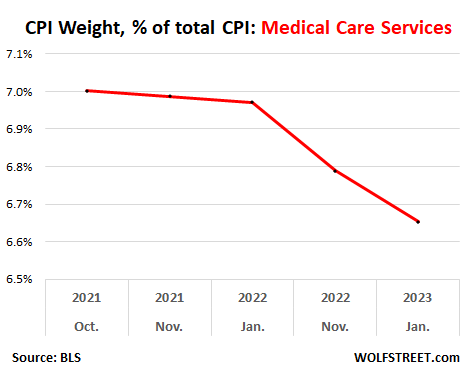
Medical care services: weight declined, and in interesting twist, pushed up overall CPI.
This category does not include medical drugs, a category of its own. Weight dropped from 6.97% in January 2022 to 6.65% in January 2023.
This is an interesting twist. Medical services include health insurance. Starting in October 2022, health insurance CPI was massively adjusted downward for the next 12 months, making up for the overstatement in the prior 12 months. After this adjustment, the health insurance CPI month-to-month has been deeply negative, and dragged overall medical care services CPI into the negative (-0.7% in January month-to-month).
By reducing the weight of medical services in overall CPI in January for 2023, the negative medical services CPI weighs less in overall CPI, and the reduction in weight of this negative number results in pushing up overall CPI. You might have to read this sentence a couple of times – like I said, an interesting twist.
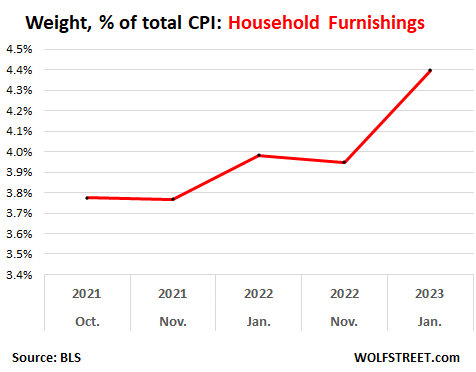
Household Furnishings: weight increased, pushed up overall CPI.
Remember what we said: these weights are adjusted on prior years’ consumption pattern. And during Covid, consumers bought all kinds of stuff to fix up their homes and patios – furniture, window and floor coverings, appliances, lamps, tools, dishes, etc., for all kinds of reasons, including to prepare the home for working from home, causing an epic spike of these types of purchases.
And the weight increased from 3.8% in November 2021 to 4.4% in January 2023. With the CPI for household furnishings jumping 0.5% month to month and 6.4% year-over-year, the higher weight of this hot category pushed up overall CPI.
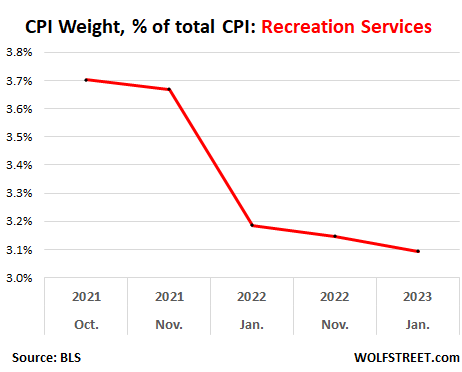
Recreation services: weight declined
This category includes video and audio subscriptions, cable, streaming services, etc. The CPI for this category has increased by 3.9% year-over-year.
The weight dropped from 3.7% in November 2021 to 3.1% in January 2023. I’m not sure why. Maybe people started going out again, and spending less on at-home entertainment services:
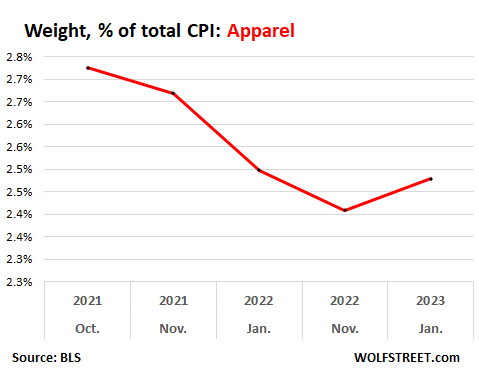
Apparel: not buying those office clothes?
Working from home was a nightmare for clothing retailers that sell clothes that people wear to the office. But some of it may now have turned around, perhaps amid a bout of revenge spending on travel attire.
The weight dropped from 2.7% in November 2021 to 2.4% in November 2022, but in January, the weight was raised to 2.5%. The CPI for apparel was hot in January, at 0.8% month-to-month, but year-over-year was up only 3.1%.
Enjoy reading WOLF STREET and want to support it? You can donate. I appreciate it immensely. Click on the beer and iced-tea mug to find out how:

Would you like to be notified via email when WOLF STREET publishes a new article? Sign up here.
![]()
[ad_2]
Source link

Gold rises as concerns over Ukraine resurface; Fed minutes in focus

Your Mid-Year Portfolio Check-Up in Four Easy Steps