Here’s Where The Surge In January Spending And Inflation Came From: Biggest Tax Drop In History
Many were expecting today’s Personal Income/Spending/PCE report to come in “a little” above consensus expectations (hence the drift lower in futures overnight). Few expected the red hot numbers just published by the BEA (hence the collapse in futures after the print).
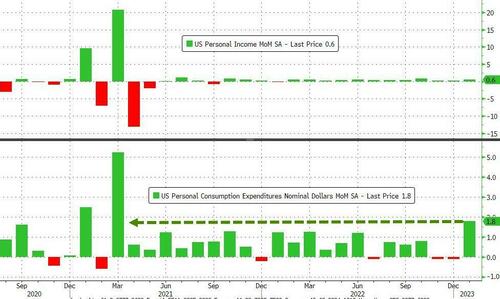
First, as noted earlier, personal spending soared by 1.8%, well above the already hot expectations of 1.4%, and the biggest jump since March 2021. This came as personal income rose by just 0.6% (below the 1.0% expected).
So far so good, but what makes historical comps difficult is that in January, there was a comprehensive overhaul of the underlying data. As the BEA notes, “for July through September, estimates for compensation, personal taxes, and contributions for government social insurance reflect the incorporation of updated third-quarter wage and salary data from the Bureau of Labor Statistics Quarterly Census of Employment and Wages program.”
Which means that January data was unique in that it was based on revised historical data, while layering on top new numbers for January, which also incorporate several fundamental changes as a result of the new year.
Before we get deeper into the weeds, we’ll note that this surge in Personal Savings coupled with a modest increase in Spending led to a burst in PCE inflation. Indeed, as Bloomberg notes, the gauge that Powell has been looking at lately, core service-sector inflation excluding housing, picked up last month, rose 0.58% from December, which is the biggest gain since back in 2021!
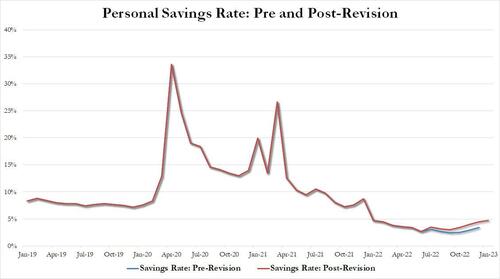
And then something odd: even though spending surged much more than income – thus boosting Personal Consumption Expenditures (i.e., inflation), the savings rate paradoxically surged. In fact it surged for the 2nd month in a row, because just one month ago, the savings rate was also revised sharply higher.
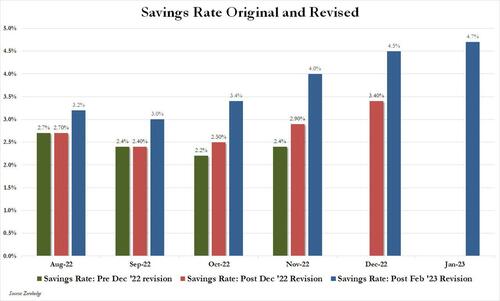
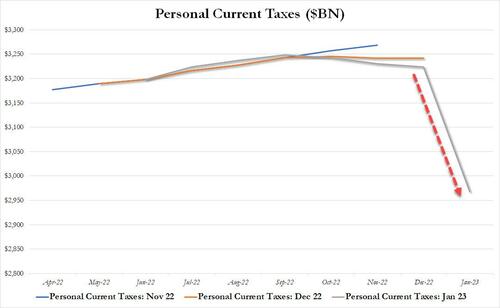
Below we show a zoomed in snapshot of how the November, December and January savings rates (post revisions) look now. The take home message: November’s savings rate has been “adjusted” from 2.4% (or $461BN in savings), to 4.0% just two months later (or $761BN), and has since grown to 4.7% (or $918BN). And that’s how you almost double America’s savings rate, if only in an excel spreadsheet.
So what happened? Well, below we show the data as reported in November, December and January (which incorporate the big revision) for Personal Income (broken down between Private and Government Wages and Salaries), Disposable Personal Income, Personal Outlays and, finally, Personal Savings and the Personal Savings Rate.
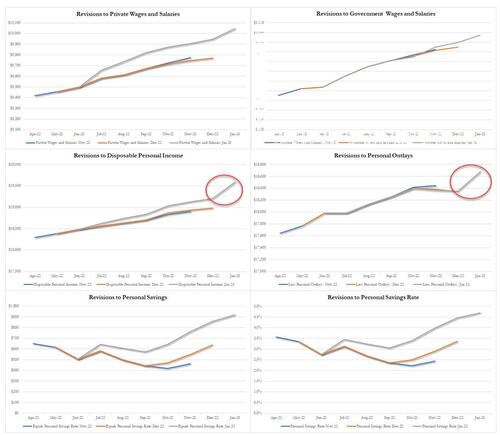
In the chart above, note that while both private and government wages and salaries rose notably in January, in part due to Social Security COLA adjustments and new minimum wages for 2023, this was nothing compared to the surge in personal income and outlays, which we have highlighted in red.
Why did personal income (and thus outlays, savings and PCE/inflation) all surge so much more than income?
The answer: taxes collapsed.
As shown in the chart below, the BEA reports that in January, total personal current taxes collapsed by a record (in dollar terms), and near-record (in percentage terms): from $3.223.9BN to just $2.968BN (both presented on a SAAR basis).
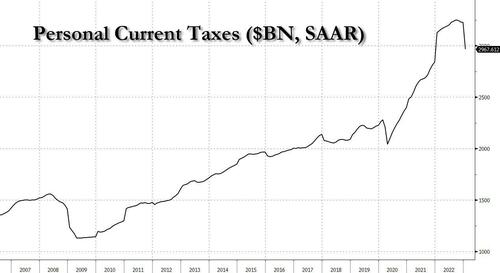
Here is the personal current tax data over a longer time frame (feel free to play with this on your own Bloomberg terminal: PIDSPTAX Index GP <go>)…
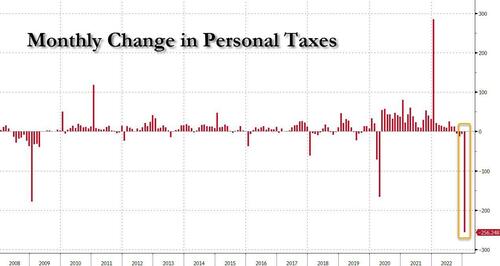
… and the monthly change in $ terms: the $256BN tax drop in January was the biggest in history, surpassing the plunge from the March 2020 covid crash and the Jan 2009 Global Financial Crisis crash!
So what’s the deal: have Democrats quietly become the party of tax cuts? Or is the economy quietly suffering through a slowdown that is worse than both the global financial crisis and the covid lockdown?
We doubt any of those two explains what’s happening: instead, the likely answer is some combination of state tax cuts, changes in income brackets, seasonal approximations and extrapolations of actual tax payments, and other components we hope to quantify soon.
Meanwhile, unaware of the unique one-time adjustments behind today’s red-hot data, the market has darted out of the barn and is already pricing in rate hikes in March, May and June and has boosted the risk of a 50bps rate hike in the next meeting!
The bottom line, however, is that just like JPM raged about seasonal adjustments overnight, hinting that underlying data no longer makes any sense, so today’s personal income/spending data should be taken with a giant grain of salt, and that the “numbers” resulting from the combination of various historical revisions, seasonal adjustments, and approximations which have magically doubled the amount of money Americans have allegedly saved, boosting both headline and core PCE, are at best a one-month adjustment, one which will promptly revert to the “higher for much longer” tax trendline, which in turn will translate into lower spending, savings and, of course, consumption in the coming months.
Loading…
[ad_2]
Source link
It is now clear that QE was a collossal mistake

Why Economic Collapse is Inevitable