The Most Splendid Housing Bubbles in America, March Update: Biggest Monthly Price Drops Now in Las Vegas, San Francisco, Seattle, Phoenix, Dallas, Denver
Double-digit drops from peak in San Francisco Bay Area, Seattle, San Diego, Phoenix, Las Vegas.
By Wolf Richter for WOLF STREET.
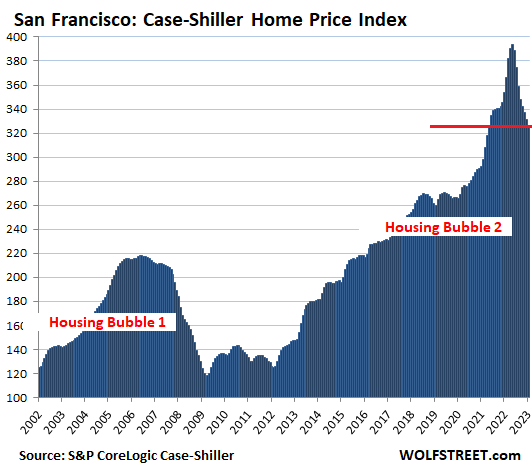
View of Housing Bubble 2 in the San Francisco Bay Area:
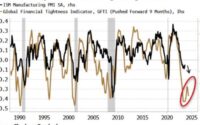
This time, it’s not an unemployment crisis that is taking down the housing market. The labor market is still tight with big pay increases – though the tech and social media segments have begun to wobble. But it’s mortgage rates that have reverted to the pre-QE normal levels of 6% to 7% amid CPI inflation in about the same range. And they’re clashing with home prices that had spiked maniacally under the Fed’s QE and interest rate repression.
And so home prices dropped further, according to the S&P CoreLogic Case-Shiller Home Price Index for “January” – which is a three-month moving average of home sales that were entered into public records in November, December, and January, reflecting deals made largely in October through December.
On a month-to-month basis, today’s Case-Shiller Index for single-family house prices dropped in 19 of the 20 metros that it covers. Miami was the only exception, where the index remained essentially flat. The 10 biggest month-to-month drops occurred in:
- Las Vegas: -1.4%
- San Francisco Bay Area: -1.3%
- Seattle: -1.4%
- Phoenix: -1.2%
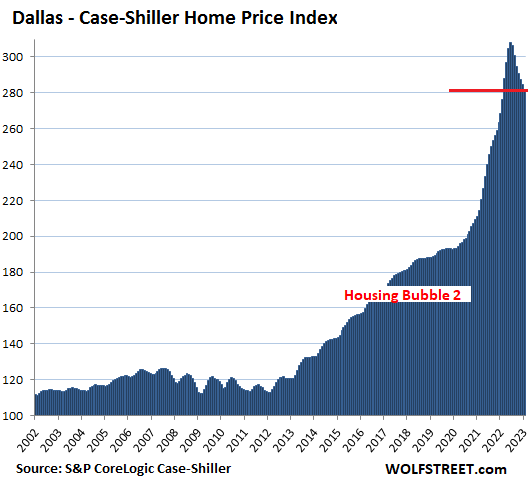
- Dallas: -0.9%
- Denver: -0.9%
- Chicago: -0.5%
- Portland: -0.7%
- Tampa: -0.7%
- Washington D.C.: -0.7%
Prices down the most from their respective peaks (ranging from May to July 2022) in these metros:
- San Francisco Bay Area: -17.1%
- Seattle: -16.3%
- San Diego: -11.5%
- Phoenix: -10.5%
- Las Vegas: -10.1%
- Denver: -9.5%
- Portland: -8.6%
- Dallas: -8.5%
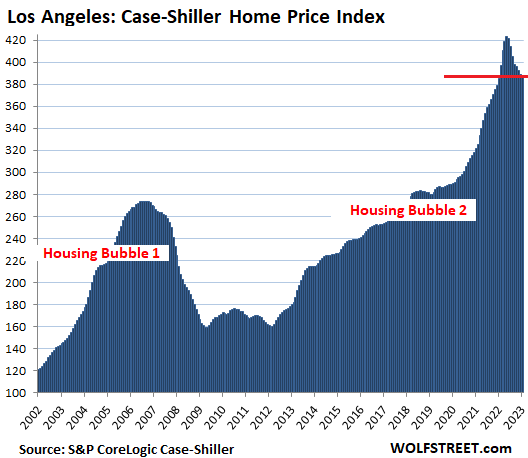
- Los Angeles: -8.3%
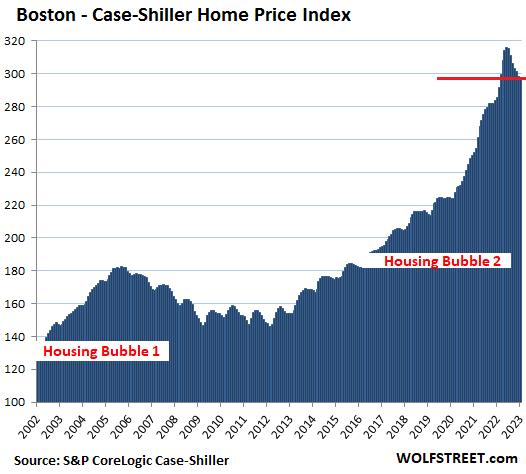
- Boston: -5.7%
Priced down year-over-year now in four of the 20 metros:
- San Francisco Bay Area: -7.6%
- Seattle: -5.1%
- San Diego: -1.4%
- Portland: -0.5%
Down faster than up is a rare occurrence in housing markets, but it’s happening in the San Francisco Bay Area where prices fell faster in the eight months since the peak, than during the eight months leading up to the peak. The metros of Seattle and Las Vegas got close (percentages from and to peak):
- San Francisco Bay Area, peak in May: -17.1%; +15.7%.
- Seattle, peak in May: -16.3%; +19.7%.
- Las Vegas, peak in July: -10.2%; +11.6%.
Methodology. The Case-Shiller Index uses the “sales pairs” method, comparing sales in the current month to when the same houses sold previously. The price changes are weighted based on how long ago the prior sale occurred, and adjustments are made for home improvements and other factors (methodology). This “sales pairs” method makes the Case-Shiller index a more reliable indicator than median price indices, but it lags months behind.
The San Francisco Bay Area housing market is not only impacted by mortgage rates, but also by the stock market – especially by IPOs and SPACs, which have mostly collapsed, and by the tech and social media giants that are now laying off highly paid workers. But these home prices released today are based on closed sales in January and earlier, so the recent fireworks are still not reflected. That’s still to come.
The Case-Shiller index for “San Francisco” covers five counties of the nine-county San Francisco Bay Area: San Francisco, part of Silicon Valley, part of the East Bay, and part of the North Bay.
- Month to month: -1.3%.
- From the peak in May: -17.1%.
- Year over year: -7.6%.
- Lowest since May 2021.
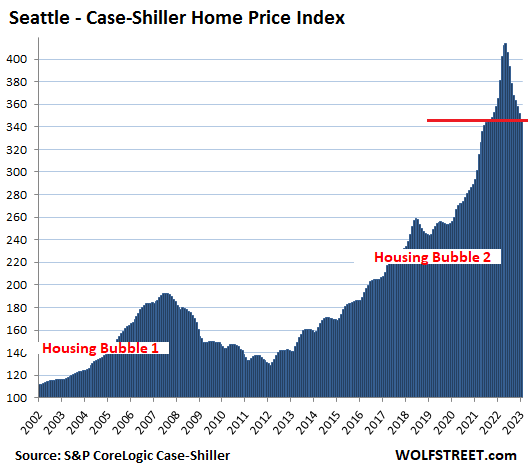
Seattle metro:
- Month to month: -1.4%.
- From the peak in May: -16.3%.
- Year over year: -5.1%.
- Lowest since September 2021.
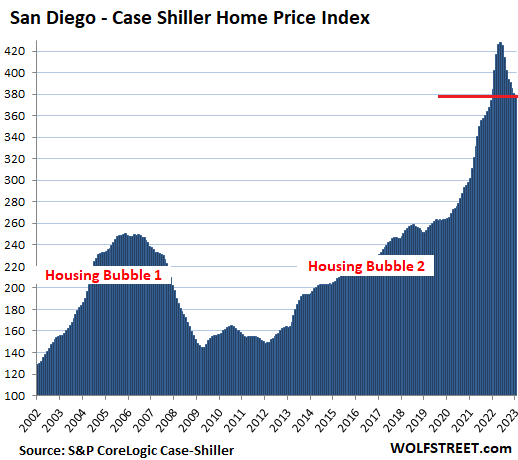
San Diego metro:
- Month to month: -0.4%.
- From the peak in May: -11.5%.
- Year over year: -1.4%.
- Lowest since January 2022.
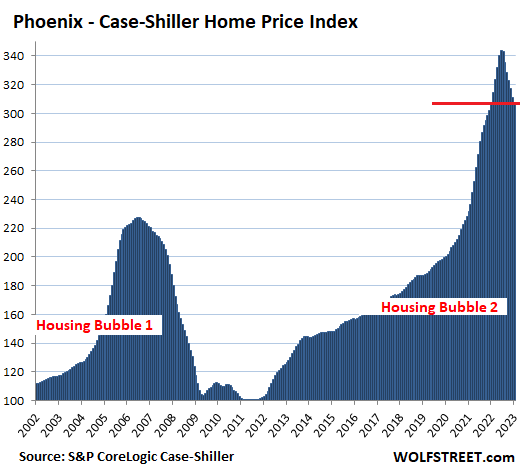
Phoenix metro:
- Month to month: -1.2%.
- From the peak in June: -10.5%.
- Year over year: flat
- Lowest since January 2022.
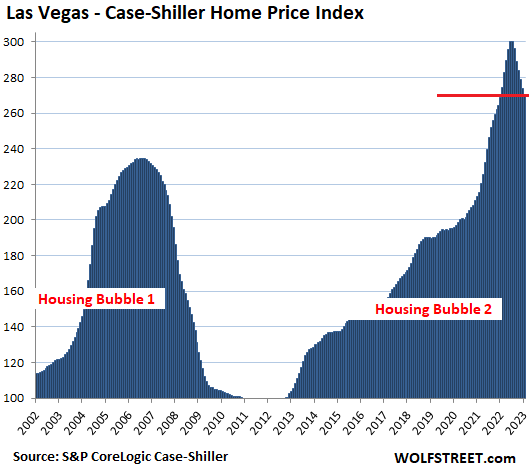
Las Vegas metro:
- Month to month: -1.4%.
- From the peak in July: -10.1%.
- Year over year: +0.4%
- Lowest since January 2022
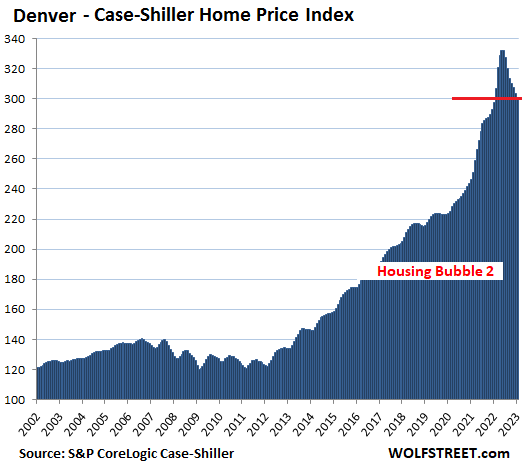
Denver metro:
- Month to month: -0.9%.
- From the peak in May: -9.5%.
- Year over year: +1.0%.
- Lowest since January 2022.
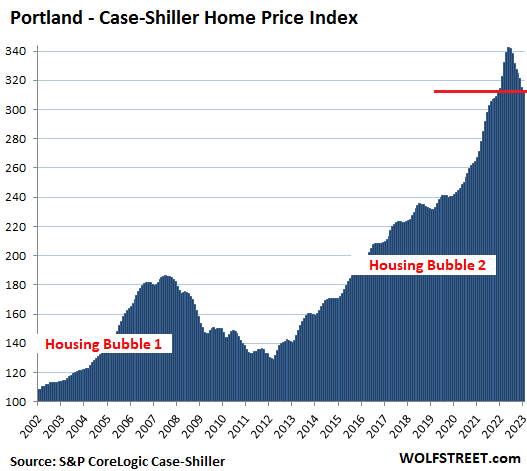
Portland metro:
- Month to month: -0.7%.
- From the peak in May: -8.6%.
- Year over year: -0.5%.
- Lowest since December 2021.
Dallas metro:
- Month to month: -0.9%.
- From the peak in June: -8.5%.
- Year over year: +5.0%
Los Angeles metro:
- Month to month: -0.2%.
- From the peak in May: -8.3%.
- Year over year: +0.9%.
- Lowest since January 2022.
Boston metro:
- Month to month: -0.3%.
- From the peak in June: -5.7%.
- Year over year: +4.2%
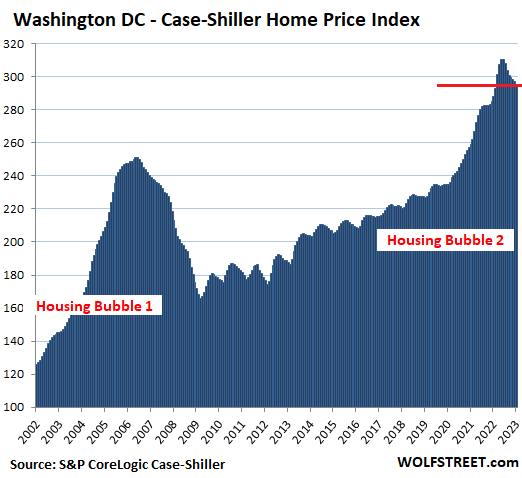
Washington D.C. metro:
- Month to month: -0.7%.
- From the peak in June: -5.0%.
- Year over year: +2.4%
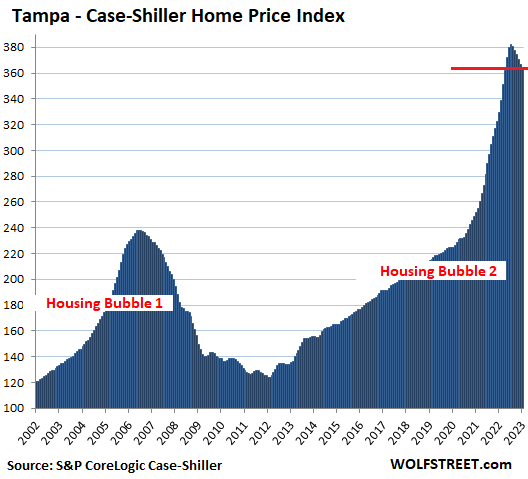
Tampa metro:
- Month to month: -0.7%.
- From peak in July: -4.7%
- Year over year: +10.5%
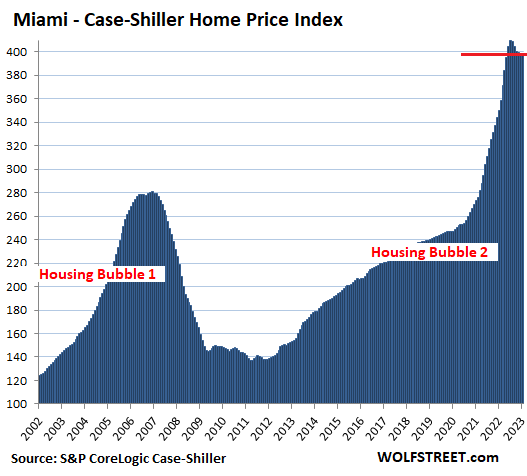
Miami metro:
- Month to month: essentially flat (less than +0.1%).
- From peak in July: -2.6%
- Year over year: +13.8%
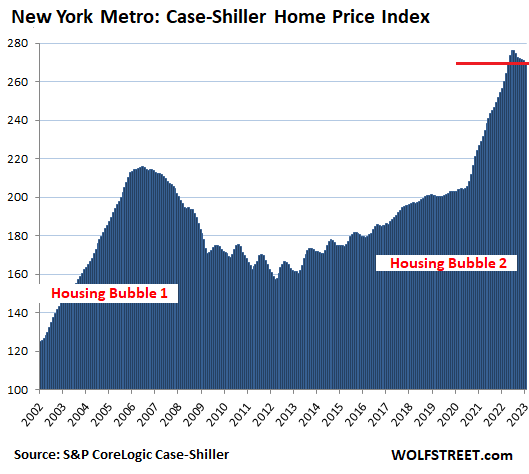
New York metro:
- Month to month: -0.4%.
- From peak in July: -2.3%
- Year over year: +5.2%
For the Miami metro in January and also in December, the Case-Shiller Index had a value of 399 points. The Case-Shiller indices were set at 100 for the year 2000. So Miami house prices are still up 299% since 2000, despite the recent dip. This makes Miami the #1 most Splendid Housing Bubble in terms of price increases since 2000. Miami has moved into the #1 slot because its prices have fallen less than the prices in Los Angeles and San Diego, the prior #1s at different times.
The New York metro index value of 270 indicates that house price inflation since 2000 was 172%, and as crazy as this still is, it forms the tail end of this list of the Most Splendid Housing Bubbles.
In the remaining six markets in the Case Shiller index, home prices have risen far less since 2000, and so they don’t qualify for this list. But in all of them, prices have declined for months. The declines in today’s Case-Shiller index: Chicago (-0.5%), Charlotte (-0.3%), Minneapolis (-0.9%), Atlanta (-0.3%), Detroit (-0.6%), and Cleveland (-0.6%).
Enjoy reading WOLF STREET and want to support it? You can donate. I appreciate it immensely. Click on the beer and iced-tea mug to find out how:

Would you like to be notified via email when WOLF STREET publishes a new article? Sign up here.
![]()
[ad_2]
Source link

Expect $2,500 – $3,000 Gold In Next 12 Months
Pros and Cons of Investing in Physical Precious Metals