Housing Market Takes Another Step Back: Home Prices Drop Year-over-Year for Second Month. Already Dismal Sales Fell
Investors lost interest too: Sales to all-cash buyers plunged 24% year-over-year.
By Wolf Richter for WOLF STREET.
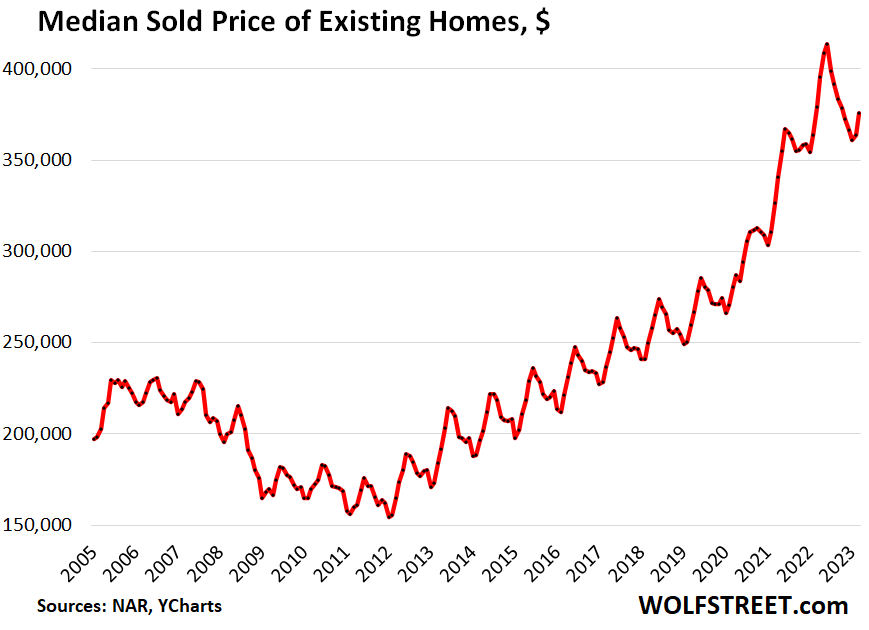
The median price of all types of previously owned homes – houses, condo, co-ops – whose sales closed in March, fell year-over-year by 0.9% to $375,700, according to the National Association of Realtors. This was the second year-over-year decline in a row since February 2012, when the market emerged from Housing Bust 1 (historic data via YCharts):
For single-family houses, the median price fell 1.4% year-over-year, the second year-over-year decline in a row. But for condos, the median price still increased 2.1% year-over-year.
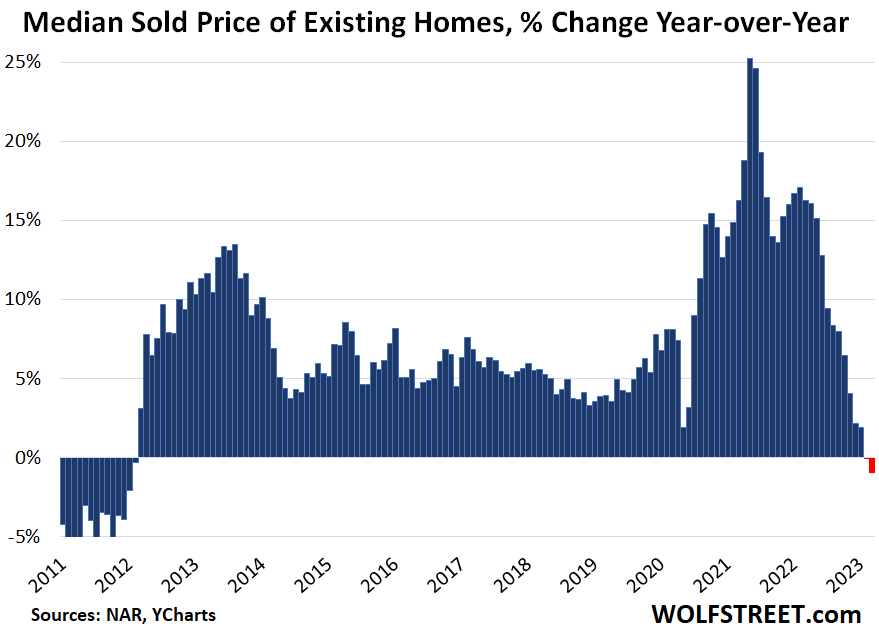
The year-over-year decline of the overall median price came despite the 3.3% month-to-month increase in March from February. But it’s spring selling season when prices typically rise, and that increase was smaller than last year’s February-to-March increase; hence the bigger year-over-year decline.
The median price has fallen by 9.2% from the seasonal peak in June 2022 (historic data via YCharts):
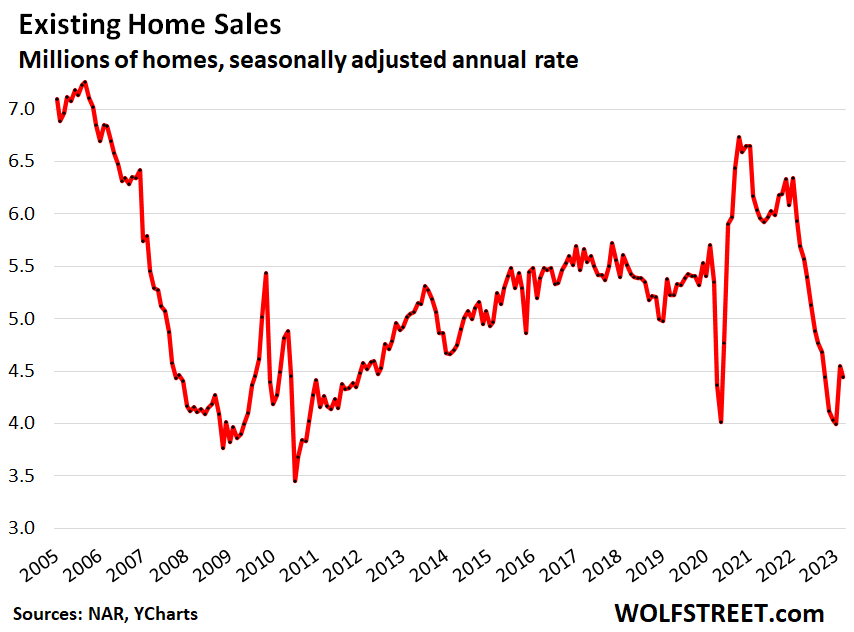
Sales of previously owned homes fell by 2.4% in March from February, to a seasonally adjusted annual rate of sales of a dismal 4.44 million homes, undoing part of the jump in February from deep-dismal January, which had been the worst month since 2010. So there had been 12 months in a row of month-to-month declines through January, an increase in February, and now another decline in March.
Compared to March 2022, sales were down 22%. Compared to March 2021, sales were down 26.5%. Compared to March 2019, sales were down 15%. Compared to March 2018, sales were down 19%.
Priced right, just about any property will sell. And lower prices would bring out the buyers which would help unfreeze the market, given these mortgage rates.
But sellers – including those that bought a home and moved into it but haven’t put the home they moved out of on the market, which was the thing to do to ride up the price spike all the way – well, they’re are still thinking that this too shall pass. “This too” being the 6%-plus mortgage rates, or rather the 4%-plus mortgage rates, which we had exactly a year ago, because that’s when the market started to derail.
Actual sales in March – not seasonally adjusted, not annual rate – fell 21% year-over-year to 360,000 properties. This was up from February, as it is nearly every year due to the seasonality of home sales, but it was up less than in March last year.
Sales of single-family houses, at a seasonally adjusted annual rate of 3.99 million in March, were down 2.7% from February and down 21% from March last year.
Sales of condos and co-ops, at a seasonally adjusted annual rate of 450,000 in March, were flat with February and down 29% year-over-year.
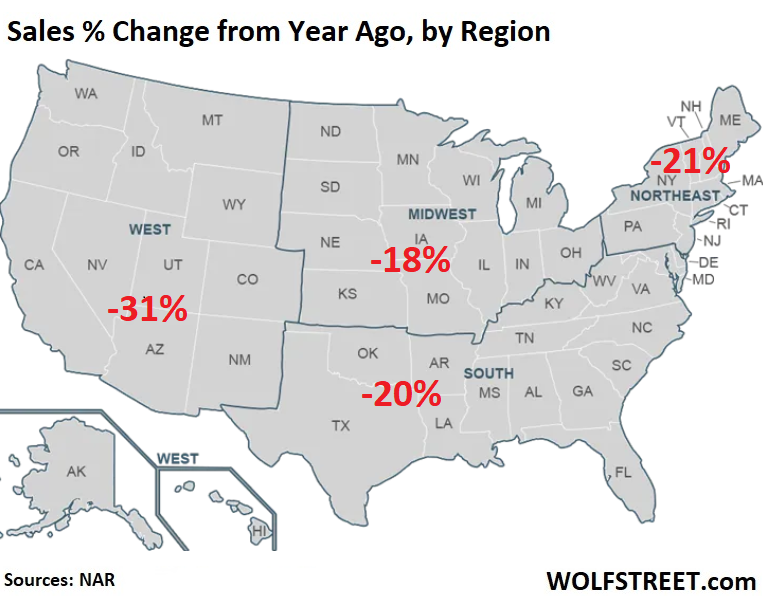
By region, year-over-year sales plunged in all regions (percent change from year ago, map via NAR):
Sales to all-cash buyers – often investors and second home buyers – plunged 24% year-over-year to 96,000 properties in March, from 127,000 properties in March 2022.
Median days on the market lengthened. Homes that actually sold spent 29 days on the market in March, up from 17 days in March last year, according to the National Association of Realtors.
Another measure of median days on the market also lengthened: Homes were either sold or were pulled off the market after 54 days in March, up from 36 days a year ago, according to realtor.com.
Months’ supply, at 2.6 months, was up from 1.9 months a year ago, but remained low by historical standards.
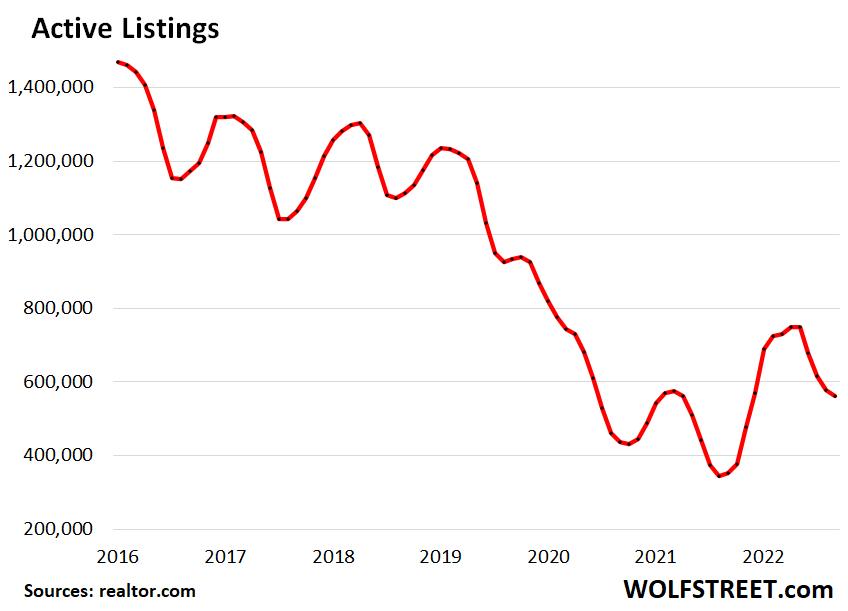
Active listings (= total listed inventory minus properties with pending sales), at 563,000 properties, were up by 60% from a year ago. The first three months of the year are usually the low points for active listings, and if historical patterns play out, they will rise from here.
But active listings remained low by historical standards as potential sellers are still trying to outwait the increase in mortgage rates, and as potential buyers have pulled back, and the market – as depicted by the dismal sales despite lower prices – remains partially frozen (data via realtor.com):
Enjoy reading WOLF STREET and want to support it? You can donate. I appreciate it immensely. Click on the beer and iced-tea mug to find out how:

Would you like to be notified via email when WOLF STREET publishes a new article? Sign up here.
![]()
[ad_2]
Source link
Walk Away Conrad! Fitch Downgrades REIT Sector To ‘Deteriorating’ As REITs Underperform S&P 500 Index (SF Hilton/Park 55 Hotels Owner Walk Away From Payments) – Confounded Interest – Anthony B. Sanders

Testing The Financial Structures Inspired By Easy Money – The Felder Report