Utter Chaos at the Short End of the Treasury Market and at the 28-Day Treasury Bill Auction: A Deep Dive
Investors exacting their pound of flesh for the risk of a default “as early as” June 1.
By Wolf Richter for WOLF STREET.
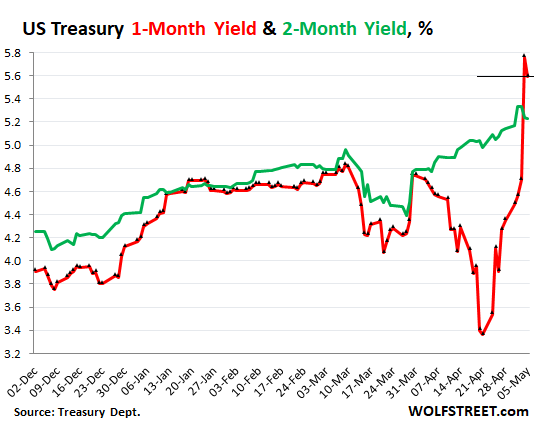
The chaos has been going on for weeks. And then it got funny at the Treasury auction on Thursday. Back on April 20, I marveled that the totally crazy 164-basis-point spread between the one-month and two-month Treasury yields: the one-month yield collapsed to 3.4% in just days (from 4.8%), while the two-month yield was just fine, ticking up past 5%. A plunging yield means that the price is surging amid huge demand. Investors were piling into a safe asset that will give them their money back in about a month, before June. What might happen in June? The US might default. That was the calculus back then.
Then on May 1, Secretary of the Treasury Janet Yellen moved X-Day forward to June 1. She warned Congress that the US will default on its obligations “potentially as early as June 1, if Congress does not raise or suspend the debt limit before that time.”
On Thursday, May 4, the 28-day Treasury bill auction went haywire.
The auction had been scheduled well in advance. For sale would be $50 billion in 28-day Treasury bills. These bills will be issued on May 9 and mature, uhm, on June 6. So let me just show you this chart of the one-month yield (red) and the two-month yield (green), and we’ll dive into the chaos of what happened in a moment. In normal times, those two lines run roughly in parallel.
June 6 is of course “potentially,” as Yellen would say, right smack-dab after the US runs out of money, when the US will be “potentially” unable to pay investors their interest and principal on those bills that were sold at auction on Thursday. And that would be a bummer.
Investors exacting their pound of flesh.
Turns out, lots of investors were willing to take the risk, if they’d be paid adequately for taking that risk – which is how it normally is with bonds. In total, the $50-billion auction got $126 billion in bids, of which $50 billion were accepted (results).
But the yields were crazy – I mean, not crazy, they were very rational, given the risk of a US default at around the time the bills would mature.
Remember, the one-month yield had plunged to 3.4% on April 20. By May 3, Wednesday, the day before the auction, it had re-spiked to 4.7%. Thursday evening, following the auction, the one-month yield closed at 5.76%! In the span of two weeks, the one-month yield had spiked by 240 basis points.
Investors were bidding huge amounts – $126 billion for a $50 billion auction – but at huge rates. The $50 billion in tenders that were accepted had rates at or lower than 5.84% (the “high rate”). That’s what it took to sell $50 billion in bills!
That 5.84% was 114 basis points higher than the one-month yield traded in the market the day before.
The median rate was 5.50%, meaning half of the competitive tenders that were accepted had bid above 5.5% and half below 5.5%.
All auction rates here are annual rates, as if the security paid interest for 360 days at this rate.
Bills (one year or less in maturity) are sold at a discount and the interest is added when the bill matures. But notes and bonds (over one year in maturity) have interest coupon payments that are paid twice a year, and the year is figured on 365 days. This makes the yields difficult to compare – which is why the Treasury Department also reports the “investment rate” of bills.
The “investment rate” of that bill auction was 5.964%! This rate is based on the 5.84%, but calculated to allow for comparisons to the coupon interest that notes and bonds pay semiannually (with the year being lengthened to 365 days).
This huge jump in auction rates didn’t make it into the Tradeweb-based charts on Thursday.
The charts of the one-month Treasury yield, based on Tradeweb data (such as the charts by CNBC, MarketWatch, etc.) did not reflect the spike in yields on Thursday. They show a closing yield on Thursday of 4.56%, and everything appeared normal, even as the auction rates had gone haywire.
But the Treasury Department’s closing yields that it reported on Thursday already showed the huge spike in yield, from 4.70% on Wednesday to 5.76% on Thursday, a 106-basis point blowout.
My Treasury yield charts are always based on the closing data from the Treasury Department, not on Tradeweb data (because I don’t have access to Tradeweb data, which is for the big boys, LOL).
And then on Friday, the Tradeweb-based charts caught up with the Treasury Dept. data and showed the huge spike in yields that my charts had already shown on Thursday.
But on Friday, the official closing yields by the Treasury Department dropped 17 basis point from the spike-close on Thursday, to 5.59%.
Meanwhile, back at the ranch…
With all this intense drama going on around the 28-day bill auction and the one-month yield in the markets, the two-month yield was doing just fine, and closed on Friday at 5.23% (green line). This is the same chart as above (both based on Treasury Dept. data), so you don’t have to scroll back up. It shows the stunning disconnect of the one-month yield from the two-month yield:
One more complication...
The Treasury yield cited in any yield data is a “constant maturity yield,” a construct based on market yields of Treasury securities of various types that mature in the time-frame of the yield. For example, the one-month Treasury yield you can look up anywhere is not an index of one-month bills. And it’s not based on auction yields. But it’s a construct of market yields by securities of various terms that mature in about one month.
In theory, and at the most simplified level, a 10-year Treasury note that matures in six months trades like a six-month bill that was just issued (there are of course big differences in reality, including liquidity). But this basic principle is what underlies the calculations of the one-month yield, the two-month yield, the two-year yield, etc.
Chaos in Treasury bills cropped up before: Lehman Moment.
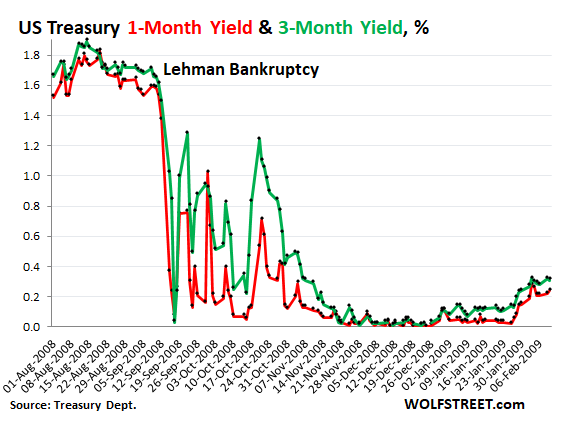
It’s not like chaos doesn’t happen periodically in the market of short-dated Treasuries. The other stunning example of chaos in recent memory was what happened after Lehman Brothers filed for bankruptcy on September 15, 2008.
In August 2008 through Friday September 12, after the Fed had been cutting rates amid a blooming financial crisis, the one-month yield fluctuated between 1.5% and 1.7%, and the three-month yield between 1.6% and 1.8%.
Then over the weekend, Lehman filed for bankruptcy. That week, both yields plunged to near 0% on Fed action, but then spiked back, with the three-month yield (green) spiking by 125 basis points in three days, from 0.03% to 1.28%, before plunging again. And then it repeated that feat a month later. This whole episode settled down in early 2009. Just for good old times’ sake:
Enjoy reading WOLF STREET and want to support it? You can donate. I appreciate it immensely. Click on the beer and iced-tea mug to find out how:

Would you like to be notified via email when WOLF STREET publishes a new article? Sign up here.
![]()
[ad_2]
Source link
Reversal Of Fortune! Fed Funds Futures Point To Feb ’23 Reversal Of Fed Rate Hikes (Recession Alert!) As Crippling Inflation Soars – Confounded Interest – Anthony B. Sanders

Lawmakers furious at Democratic leaders after stock trading ban stalls