Despite Fed Tightening and Bank Collapses, It’s Still an Astoundingly Loose Financial Situation in La-La-Land
After years of money printing and pandemic stimulus, it’s hard to wring all this liquidity out of the financial system?
By Wolf Richter for WOLF STREET.
Financial conditions and lending standards have become less loosey-goosey than they were during the free-money era when deposits paid 0% interest, and banks borrowed from their depositors for free. And “financial stress,” which spiked briefly during the SVB collapse, subsided again and returned to loosey-goosey, but just a little less loosey-goosey than during the free money era. It’s like the partying is over, but now they’re just relaxing in la-la-land, instead of suffering from a hangover.
The weekly St. Louis Fed Financial Stress Index, one of the products that came out of the Financial Crisis, measures financial stress in the credit markets and was designed to indicate when another financial crisis might be at the doorstep. It dutifully spiked when SVB collapsed in mid-March, but only briefly and not very much, and then settled down again in la-la-land.
A level of zero indicates normal market conditions. A level above zero indicates above-average market stress; below zero indicates below-average market stress. It’s below zero: -0.35 per the latest release on Thursday. During the SVB collapse, it was above zero for two weeks, on March 17, when it spiked to +1.54, and on March 24, when it fell back to +0.34. Then it returned to the negative readings of la-la-land (green line = current level):
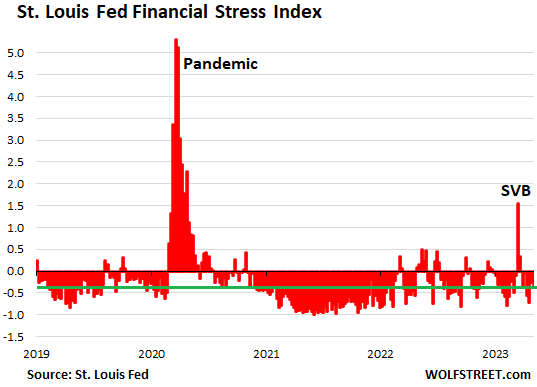
The big rate hikes last year led to a series of mini-spikes into above-normal but still low levels of financial stress. Not this year; the rate hikes didn’t add financial stress. This year it took the sudden and messy SVB collapse to add financial stress.
But the First Republic collapse just caused financial markets to yawn. Same-old same-old already?
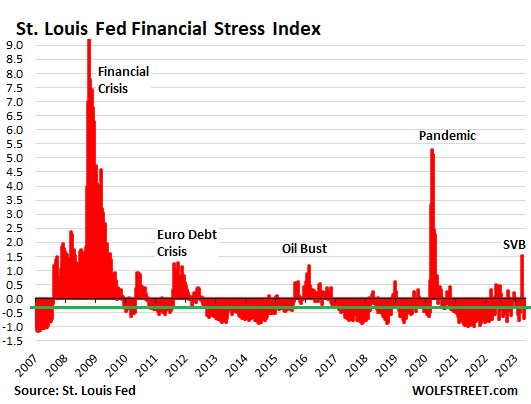
The St. Louis Financial Stress Index tracks 18 variables: a variety of Treasury yields, corporate bond yields, Treasury spreads, corporate bond spreads, SOFR spreads (which replaced the LIBOR spreads), and other spreads, plus indicators such as the VIX and the Treasury 10-year breakeven inflation rate.
During the Financial Crisis, just after the Lehman bankruptcy, the index spiked to +9.25, so that’s about six times the value during the SVB collapse (+1.54).
We also see the euro debt crisis show up in the US credit markets in 2011-2012.
And we see the US oil bust that started in 2015 and sent dozens of US oil and gas companies into bankruptcy court. The Fed had kicked off its rate-hike cycle in December 2015 despite the core PCE price index being at 1.1%, well below the Fed’s 2% target. Spooked by the turmoil in oil-and-gas credits, and with inflation below target, the Fed paused for a year, before continuing. (Green line = current level).
Financial conditions a little less loosey-goosey.
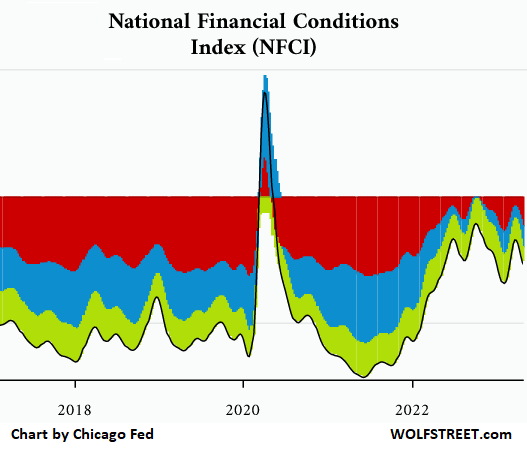
The broader Chicago Fed’s National Financial Conditions Index (NFCI) shows a similar situation: “financial conditions loosened again,” it said for the latest reporting week, as the index dipped to -0.28, with all three sub-indicators – risk (red), credit (blue), and leverage (green) – contributing to the negative reading.
The index too is constructed to have an average value of zero based on data going back to the 1970s. You can see that the free-money party was surely a lot of fun, but that it is now over, and now financial conditions are just relaxing in la-la-land, instead of partying in it.
You can see the SVB collapse in that little dent on the right. But financial conditions remained less tight than average. And the First Republic collapse didn’t even register (chart via Chicago Fed):
So, despite the rate hikes and QT by the Fed, financial conditions are still looser than the long-term average, though they have become somewhat less loosey-goosey than during the free-money era.
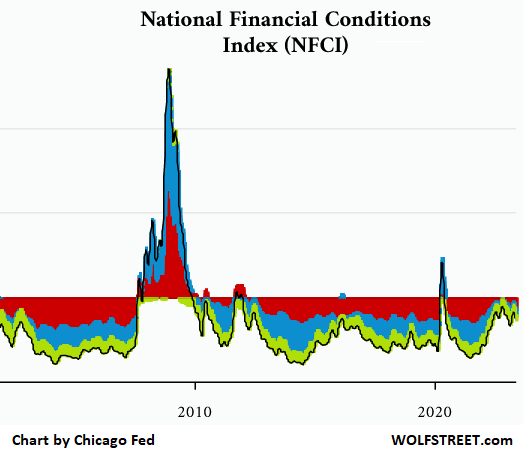
The long-term view shows what happens when financial conditions actually tighten: we see the Financial Crisis, the Euro Debt crisis in 2011/2012, the the oil bust, and the spike in March 2020.
Demand for bank loans drops, amid higher rates. Lending standards tighten.
The quarterly Senior Loan Officer Opinion Survey on Bank Lending Practices (SLOOS) for April 2023 was also released last week.
Loan demand is down from businesses and consumers, which makes sense because interest rates have risen, and borrowing has become more expensive and isn’t a freebee anymore. There was less demand from businesses for commercial and industrial loans and for CRE loans. In terms of consumers, home sales have plunged, so there’s less demand for mortgages. And there was also less demand for auto loans.
But wait… these are banks reporting on auto-loan demand; the automakers’ captive finance companies, which are the biggest auto lenders, have been offering subsidized lower rates to stimulate volume on certain models.
For example, Ford Credit is offering 3.9% APR for 60 months on 2023 Ford-150 XLT pickups. But Bank of America is now advertising a new-vehicle rate of 5.99% APR for 60 months.
In other words, these loan officers might simply be reporting that their auto lending business has further shifted away from the banks to the captives.
More loan officers on net reported tightening lending standards across the board, except for consumer mortgages backed by the government, which is the majority; for them, lending standards have remained unchanged.
Loan officers started tightening lending standards in July 2022. But they tightened after having loosened lending standards for five quarters in a row during the free-money era. They tightened from a very loosey-goosey base.
Enjoy reading WOLF STREET and want to support it? You can donate. I appreciate it immensely. Click on the beer and iced-tea mug to find out how:

Would you like to be notified via email when WOLF STREET publishes a new article? Sign up here.
![]()
[ad_2]
Source link
AMERICAN EMPIRE EXPIRATION DATE – The Burning Platform

We talk to Marc Faber about gold, Campbell’s Soup and his no.1 book!