Slowdown in Residential Construction Centers on Single-Family Houses. Multifamily Flattens at Highest Level Since 1986
Single-family construction still dominates, but its share of residential construction falls to the lowest in decades.
By Wolf Richter for WOLF STREET.
Construction starts of single-family houses and multifamily buildings is going through an overall slowdown from a big surge, split two ways:
- A clear slowdown in single-family starts
- A flattening out of multifamily starts at the highest levels since 1986.
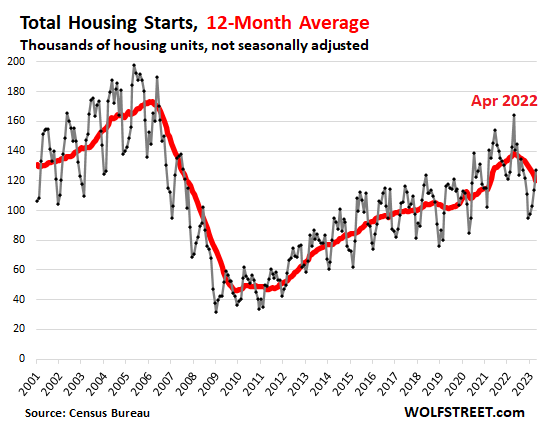
Total residential construction starts in April (black line) jumped to 127,100 housing units, not seasonally adjusted, the fourth month in a row of gains, which is typical for the season. But year-over-year, they were down 22.6%, in part due to the “base effect”: Housing starts normally peak in the summer, but last year they spiked in April (the “base” for this calculation) to levels not seen since June 2006.
The 12-month moving average (red) shows the longer-term trends and the downturn that started after the April spike last year: Down by 13.3% year-over-year, but up by 17.5% from April 2019.
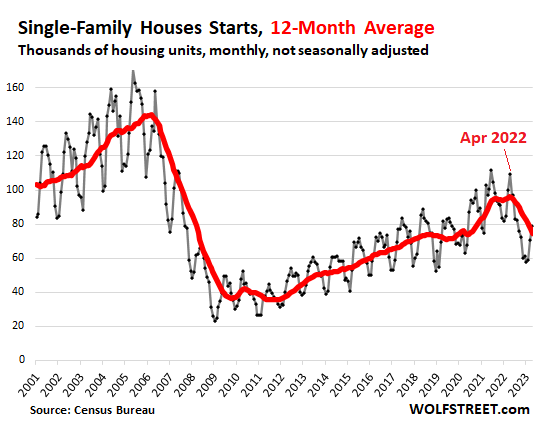
Construction starts of single-family houses rose in April for the third month in a row, as would be expected for this season, to 78,800 houses, but that was down 28.2% from April last year – in part due to the base effect.
Compared to April 2019, single-family starts were down 3.4% (black). The 12-month average in April shows the down-turn that started after the spike in April last year (red):
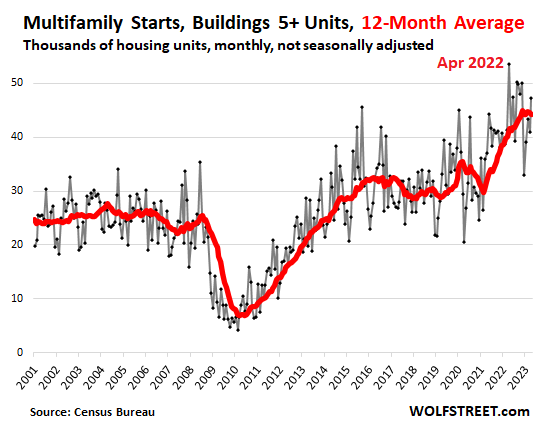
Construction starts of multifamily projects, such as condo and apartment buildings, with five or more units, also jumped in April as would be expected for this season, to 47,200 units, down 11.8% from the huge April last year (53,500), which had been the highest since 1986.
Compared to April 2019, multifamily starts were up 42.6% (black line). The 12-month average shows the recent flattening-out of the surge at the highest levels since the mid-1980s.
Multifamily projects tend to be big and can have long lead times. Projects where construction started in April were in the planning stages often years earlier.
In many densely populated urban cores, multifamily is just about the only type of housing that is getting built, and for many years already, much of it has been higher end, with lots of amenities, because that’s where the money is.
In these urban areas, the bulk of single-family construction takes place further away from urban cores. The decision whether to live in a new multifamily building in an urban core or in a new house further out comes down to lifestyle choice – and both are expensive.
Single-family construction still dominates, but its share declines. Over the past 12 months through April, the share of single-family housing starts dropped to 62% of total housing starts, the lowest share since 1986!
The share of multifamily starts (buildings of 5 and more units) rose to 37%, the highest share since 1974!
The share of multifamily starts in small buildings of 2-4 units has fallen to a historic low of about 1%.
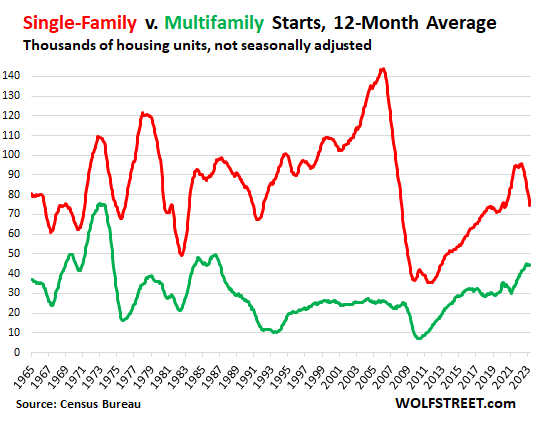
Over the long term, housing starts come and go in huge waves of booms and busts. This chart also shows why Housing Bubble 1 – with single-family starts peaking in 2005 – was such an epic creature. And it shows that the current multifamily boom is still tame compared to the boom in the early to mid-1970s (starts of single-family houses = red line; multifamily units = green).
Enjoy reading WOLF STREET and want to support it? You can donate. I appreciate it immensely. Click on the beer and iced-tea mug to find out how:

Would you like to be notified via email when WOLF STREET publishes a new article? Sign up here.
![]()
[ad_2]
Source link

Energy prices will fall when economy tips into recession, analyst says

Central Banks Must Stay the Course on Rate Hikes, OECD Says