Global Steel Production in 2022 Fell Most since 2009, Unwound Stimulus Spike of 2021. China’s Production Fell for 2nd Year
China still produced more than the rest of the world combined, 12 times more than the US.
By Wolf Richter for WOLF STREET.
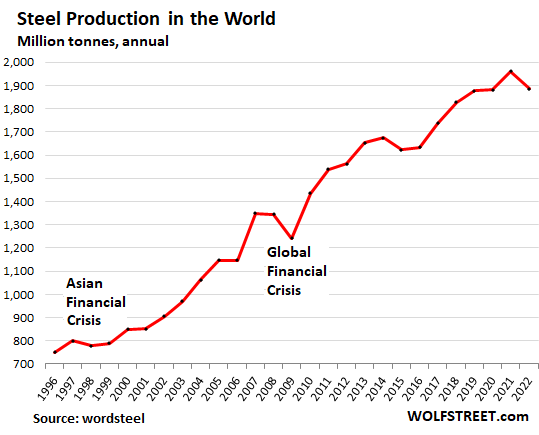
Global production of crude steel – ingots, semi-finished products (billets, blooms, slabs), and liquid steel for castings – fell by 3.9% to 1,885 million tonnes (Mt) in 2022, the first annual decline since 2015, the steepest decline since 2009, and the second-steeped decline going back to 1996, according to data from the World Steel Association. This brought production back to where it had been in 2020, thereby unwinding the stimulus-fueled jump in 2021.
Production in China, which produces over half the crude steel in the world, fell for the second year in a row, but this time less than in the rest of the world, and China’s share regained some of the ground it had lost in 2021.
There are now four episodes of falling annual crude steel production over the past 28 years:
- Asian Financial Crisis in 1998 (-2.7%);
- Global Financial Crisis in 2009 (-7.8%);
- The drop in 2015 (-3.0%);
- The stimulus-unwind in 2022 (-3.9%).
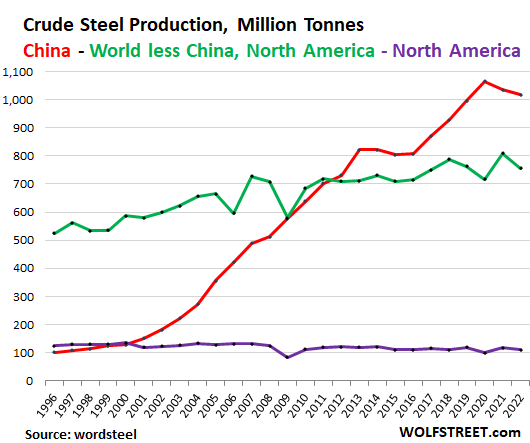
China v. the Rest of the World.
Since the year 2000, global crude steel production has surged by 122%, most of it in China: Over the period, China’s production exploded by 735%; North America’s production fell by 18%; and production in the rest of the world without China and North America rose by 29%.
In China, crude steel production in 2022 fell for the second year in a row, this time by 1.6%, to 1,018 Mt, after having fallen by 2.8% in 2021, which had been the largest decline in tonnage going back to 1996 (red line in the chart below)
In North America (US, Canada, Mexico), crude steel production has been wobbling lower below 1996 levels. In 2022, it fell 5.6% to 111 Mt, after the 16.6% surge in 2021. US production accounts for roughly three-quarters of North American production (purple).
In the rest of the world without China and North America, steel production fell 6.6% in 2022, after the 13.0% jumped in 2021 (green).
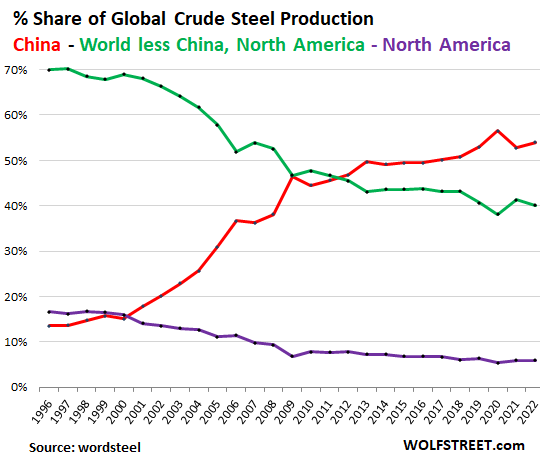
In 2020, the share of China’s steel production had jumped to a record 56.6% of global production. In 2021, the share fell to 52.7%. In 2022, as China’s steel production fell less than production in the rest of the world, its share ticked up to 54.0%.
North America’s share dipped to 5.9% in 2022. The share has been range-bound between 5.3% and 6.3% since 2017, after a long and steady downtrend from a share of 16.6% in 1996.
The share of the rest of the world without China and North America dipped to 40.1% in 2022:
Most of China’s crude steel production is used in China.
In 2022, China produced 54% of the world’s crude steel but used 52% of the world’s finished steel products – such as bar, pipe, and rolled steel – in its manufacturing and construction industries. This indicates that most of the crude steel produced in China was used in China’s manufacturing and construction sectors. China then exports large volumes of high-value manufactured products that are made of steel or contain steel, from appliances to bridge towers.
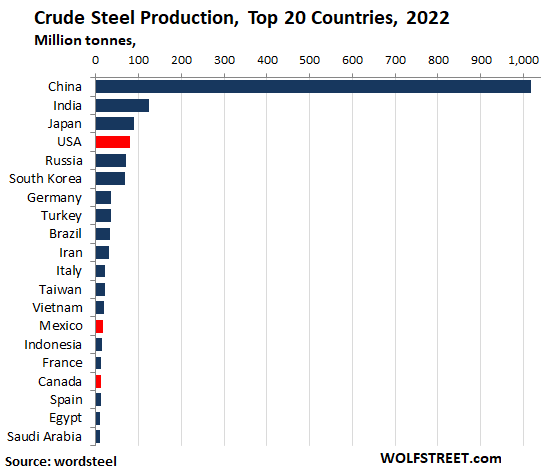
The top 20 steel-producing countries.
India (#2 in the world), Iran (#10), and Indonesia (#15) were the only three of the top 20 steel-producing countries where steel production rose in 2022 (by 5.6%, 7.0%, and 8.3% respectively). In the other 17 countries, production fell.
China’s production was 8 times the magnitude of India’s production and 12 times the magnitude of US production (#4). Production in the North American countries is marked in red:
The top 20 steel-producing companies.
The largest US steel producer, Nucor, ranks #16 globally. Eleven of the top 20 are Chinese companies. The second largest producer, ArcelorMittal, is a product of India’s giant Mittal Steel having acquired the French company Arcelor; now registered in Luxembourg and run from India.
| Top steel-producing companies | Mt | ||
| 1 | China Baowu Group | China | 131.8 |
| 2 | ArcelorMittal, includes 60% AM/NS India | Luxembourg, India | 68.9 |
| 3 | Ansteel Group, incl. Benxi | China | 55.7 |
| 4 | Nippon Steel Corporation | Japan | 44.4 |
| 5 | Shagang Group | China | 41.5 |
| 6 | HBIS Group | China | 41.0 |
| 7 | POSCO Holdings | South Korea | 38.6 |
| 8 | Jianlong Group | China | 36.6 |
| 9 | Shougang Group | China | 33.8 |
| 10 | Tata Steel | India | 30.2 |
| 11 | Shandong Steel Group | China | 29.4 |
| 12 | Delong Steel | China | 27.9 |
| 13 | Hunan Steel Group | China | 26.4 |
| 14 | JFE Steel Corporation | Japan | 26.2 |
| 15 | JSW Steel Limited | India | 23.4 |
| 16 | Nucor Corporation | United States | 20.6 |
| 17 | Fangda Steel | China | 19.7 |
| 18 | Hyundai Steel | South Korea | 18.8 |
| 19 | Liuzhou Steel | China | 18.2 |
| 20 | IMIDRO | Iran | 18.0 |
Enjoy reading WOLF STREET and want to support it? You can donate. I appreciate it immensely. Click on the beer and iced-tea mug to find out how:

Would you like to be notified via email when WOLF STREET publishes a new article? Sign up here.
![]()
[ad_2]
Source link

Druckenmiller takes aim at dollar in sole conviction trade
“It’s Off To The Races From Here”