Heading Into Earnings Season, Let’s Discuss Actual Corporate Profits – MishTalk
Companies report profits to the IRS in predictable ways. It would be nice to see standardization on earnings reports instead of pro forma garbage.

Chart Notes
- Real means inflation adjusted using 1982-1984 as the standard CPI price adjustment.
- IVA means Inventory Valuation Adjustment
- CCAdj is a Capital Consumption Adjustment used to convert measures of depreciation based on historical-cost accounting.
The lead chart puts a spotlight on what’s going on. Increasing Corporate profits are largely a function of a debased US dollar.
Please consider the BEA’s release of Corporate Profits for 2023 Q1.
Corporate profits represents the portion of the total income earned from current production that is accounted for by U.S. corporations. The estimates of corporate profits are an integral part of the national income and product accounts (NIPAs), a set of accounts prepared by the Bureau of Economic Analysis (BEA) that provides a logical and consistent framework for presenting statistics on U.S. economic activity.
Corporate profits is one of the most closely watched U.S. economic indicators. Profitability provides a summary measure of corporate financial health and thus serves as an essential indicator of economic performance. Profits are a source of retained earnings, providing much of the funding for capital investments that raise productive capacity. The estimates of profits and of related measures may also be used to evaluate the effects on corporations of changes in policy or in economic conditions.
Nominal Corporate Profits
- Profits from current production (corporate profits with inventory valuation and capital consumption adjustments) decreased $121.5 billion in the first quarter, an upward revision of $29.7 billion from the previous estimate.
- Profits of domestic financial corporations decreased $9.4 billion in the first quarter, an upward revision of $16.0 billion from the previous estimate. Profits of domestic nonfinancial corporations decreased $102.9 billion, an upward revision of $6.5 billion. Rest-of-the-world profits (net) decreased $9.2 billion, an upward revision of $7.2 billion. In the first quarter, receipts increased $9.4 billion, and payments increased $18.6 billion.
Real (Inflation-Adjusted) Corporate Profits

Declining corporate profits are a recession indicator, but lead times can be long.
The current decline in real and nominal profits is as steep as the leadup to the Great Recession.
Nominal Corporate Profits With IVA and CCAdj Percent Change

Nominal Corporate Profits Percent Change Notes
- When the BEA refers to corporate profits, it is generally referring to before tax profits with IVA and CCAdj. This is CPROFIT series on the St. Louis Fed.
- Corporate profits declined 4.1 percent in 2023 Q1 and 2.1 percent in 2022 Q4.
- I count 20 instances between 1959 and 2023 in which there are two or more consecutive quarters of declining corporate profits.
- Corporate profits declined two consecutive quarters, at least once in every recession, but also did 7 times outside of recession, including the current setup.
The BEA notes “Corporate profits represents the portion of the total income earned from current production that is accounted for by U.S. corporations.”
Read that a couple of times, then reflect on the debate regarding GDP or GDI.
Largest Discrepancy Between GDP and GDI in 20 Years
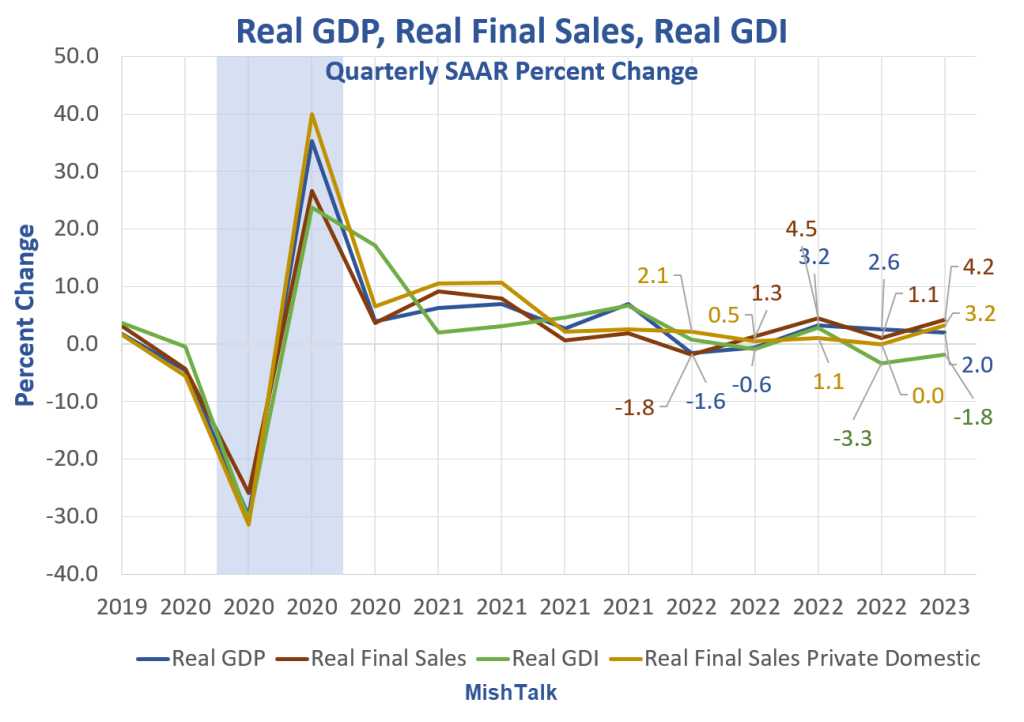
GDP vs GDI Chart Notes
- Gross Domestic Product (GDP) and Gross Domestic Income (GDI) are two measures of the same thing. They are supposed to match, and will over time, with revisions in at least one of the measures.
- Real Final Sales is is the bottom line GDP estimate. The rest is an inventory adjustment.
- In the last two quarters, GDP rose a reported 2.0 percent in 2023 Q1 and 2.6 percent in 2022 Q4.
- In the last two quarters, GDI declined a reported 1.8 percent in 2023 Q1 and 3.3 percent in 2022 Q4
Largest Discrepancy Between GDP and GDI in 20 Years
Corporate profits provide a strong reason to believe the Gross Domestic Income view of things instead of GDP. So does the discrepancy between jobs and employment.
For discussion, please see Largest Discrepancy Between GDP and GDI in 20 Years
This has been one of the most difficult economies to judge ever.
Meanwhile, take reported earnings this season with a huge dose of skepticism, or shot of whiskey, whichever you prefer. Corporations will play countless games in reporting earnings to the public vs how they report earnings to the IRS.
[ad_2]
Source link

Big Spending Bill Is a Big Problem for the Fed’s Inflation Fight