Is GDPplus a Better Version of GDP? – MishTalk
GDPPlus is a Federal Reserve Bank of Philadelphia calculation of GDP. It’s a blend of GDP (Gross Domestic Product) and GDI (Gross Domestic Income) but not an average.

GDPplus was announced in November of 2013 by the Philadelphia Fed: Bank Introduces New Measure of GDP
GDPplus is a measure of the quarter-over-quarter growth rate of real GDP in annualized percentage points. It is extracted in a statistically optimal way from the BEA’s expenditure-side estimates (GDP) and the underused income-side estimates (GDI). GDPplus is intended as an estimate of the underlying, but unobserved, U.S. economic activity that drives the BEA’s official measures of GDP and GDI.
The NBER, the official arbiter of recessions, averages GDP and GDI in dating recessions.
GDPplus is not an average. For example, consider 2023 Q1. The average of GDP and GDI is (2.0 – 1.8) / 2 = +0.1. GDPplus is -0.4 percent.
The GDPplus Working Paper is mostly geekish math, but there are some readable snips.
Aggregate real output is surely the most fundamental and important concept in macroeconomic theory. Surprisingly, however, significant uncertainty still surrounds its measurement. In the U.S., in particular, two often-divergent GDP estimates exist, a widely-used
expenditure-side version, GDPE [GDP], and a much less widely-used income-side version, GDPI [GDI].Nalewaik (2010) and Fixler and Nalewaik (2009) make clear that, at the very least, GDPI deserves serious attention and may even have properties in certain respects superior to those of GDPE. That is, if forced to choose between GDPE and GDPI , a surprisingly strong case exists for GDPI . But of course one is not forced to choose between GDPE and GDPI , and a GDP estimate based on both GDPE and GDPI may be superior to either one alone. In this paper we propose and implement a framework for obtaining such a blended estimate.
Three Key Claims
- GDI deserves serious attention and may even have properties in certain respects superior to those of GDP.
- If forced to choose between GDP and GDI , a surprisingly strong case exists for GDI.
- One is not forced to choose between GDP and GDI , and a estimate based on both GDP and GDI may be superior to either one alone.
Given that GDI is not available in the first estimate of GDP, I am not sure how GDPPlus is available, but the current GDPplus estimate for 2023 Q2 is +1.5.
Recession When?
Assuming either GDPPlus or GDI is the correct measure, the economy appears to have gone into recession in the fourth quarter of 2022.
With the BEA measuring GDP at +2.5 percent and +2.0 percent for the two quarters, the economy was not close to recession, at least by the expenditure method.
GDI vs GDP

GDP and GDI data from the BEA, chart by Mish
For discussion of GDI and GDP, please see Real GDP Beats Expectations, Rises 2.4 Percent in First Estimate for 2023 Q2
There are many reason to believe the GDI model, especially hours worked.
Labor Productivity Jumps 3.7 Percent in 2023 Q2 as Hours Worked Declines

For discussion, please see Labor Productivity Jumps 3.7 Percent in 2023 Q2 as Hours Worked Declines
Actual hours worked fell in business, manufacturing, and nonfarm business.
Tax data also is weaker than the allegedly strong jobs market would imply.
What Do Federal Tax Receipts and Total Receipts Suggest About Recession?

In case you missed it, please see What Do Federal Tax Receipts and Total Receipts Suggest About Recession?
The above chart is through 2023 Q1. Tax data for the second quarter is not yet available.
The average economist has been crowing about jobs and GDP, oblivious to GDI and falling hours worked.
[ad_2]
Source link
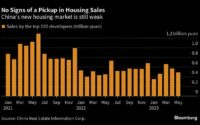
China’s Economic Woes Are Multiplying — and Xi Jinping Has No Easy Fix
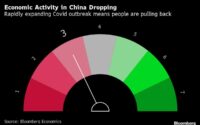
China’s Economy Is Showing Increasing Strain From the Covid Tsunami