Consumer Foreclosures, Bankruptcies, Delinquencies, and Collections: Checking on the Hangover of our Drunken Sailors
Not much of a hangover yet. Going to see more of these frying-pan charts
By Wolf Richter for WOLF STREET.
Our Drunken Sailors have been out there spending money, and some of it comes from their surging income that has been outrunning inflation finally this year, and they’re spending money from their investment gains and from surging interest income from CDs, money market funds, Treasury bills, and savings accounts. And some are spending money they’ve borrowed. And our Drunken Sailors have borrowed heavily in recent years to buy homes at fabulous prices. So now it’s time to check in on them, to see how their credit is holding up under these conditions.
The number of consumers with foreclosures edged up to 38,840 in Q2, according to data from the New York Fed’s Household Debt and Credit Report. But that was down by about 45% from the Good Times before the pandemic in 2017-2019, and down by 75% from the Good Times in 2003-2004 when the housing market was approaching the peak of the prior housing bubble.
The fiscal and monetary excesses during the pandemic, the forbearance programs, and outright foreclosure bans reduced foreclosures to near zero. And now there’s the slow return to the Good Times normal. This combination is creating a lot of these frying-pan charts:
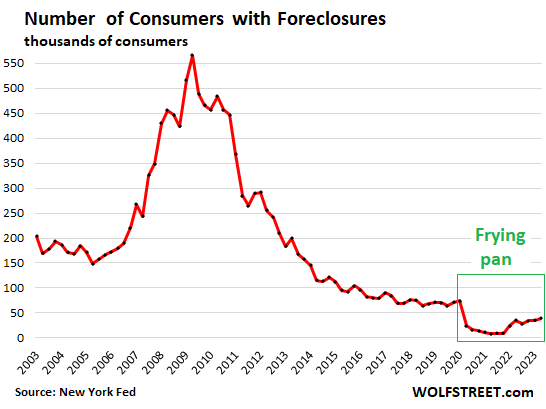
The funny thing is that in some corners, a big deal is being made of the catastrophic 340%, OMG-WOW spike in foreclosures from near zero in early 2021 during the period of forbearance and outright foreclosure bans. But a big percentage increase from near-zero gets to a level that is still very low, as you can see in the chart.
Homeowners are at risk of foreclosure if the market value of their house drops substantially below the loan value of the mortgage while they run into problems making their mortgage payments. Homeowners in some markets who bought over the past two years or so and skimped on the downpayment fall into this category.
But if homeowners have equity in the home and run into problems making their payments, they can just sell the home, pay off the mortgage, and walk away with some cash.
The problem arises when home prices drop by a whole bunch, and they have started to do that in a few markets, but still not very deep, and not broadly across the US, and the declines come after the huge run-up in home prices in recent years, and so foreclosures remain near the historic lows established during the free-money pandemic of foreclosure bans and forbearance.
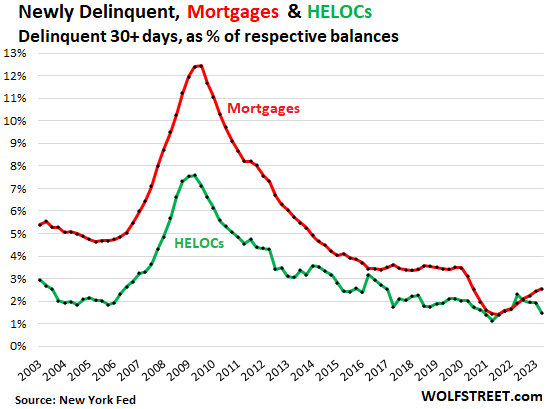
Mortgage and HELOC delinquencies have also edged up from historic lows. The rate of mortgages that transitioned into delinquencies in Q2 (30-plus days delinquent) edged up to 2.6%, but that was still down from about 3.5% during the Good Times in 2018-2019, and from 4.7% during the Good Times before Housing Bust 1, in 2005.
For HELOCs, the 30-plus-day delinquency rate dropped to 1.5%, the fourth-lowest on record (green line).
The handle of the mortgage frying pan hasn’t been installed yet. The handle of the HELOC frying pan already broke off.
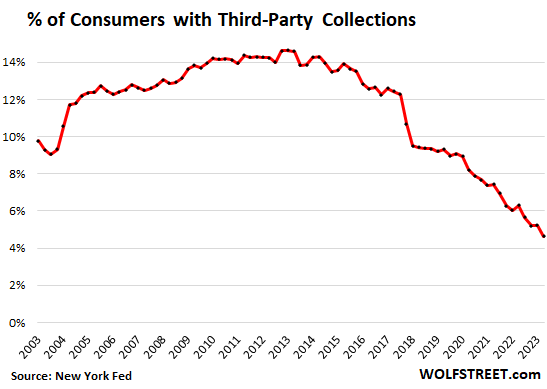
Third-party collections plunged to historic lows in Q2. The portion of Consumers with third-party collections on their credit reports dropped to just 4.6%, the lowest in the data going back to 2003.
This is where defaulted credit card accounts and other revolving credit accounts, such as personal loans and payday loans, tend to eventually end up.
Third-party collections are registered on a consumer’s credit report after a lender sold a delinquent account for cents on the dollar to a collection agency which will then hound the defaulter to obtain a settlement amount, and they might use wage garnishments, etc., in the hope of collecting significantly more than the cents-on-the-dollar they paid for the account.
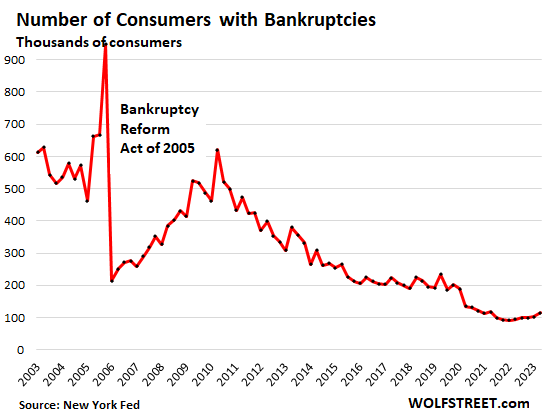
Consumer bankruptcies also hit historic lows during the free-money pandemic and have since then been edging higher but remain near historic lows.
In Q2, the number of consumers with bankruptcies inched up a tad to 114,000 consumers, still down by about 40% from the Good Times average of 2017-2019 of around 200,000, and down by 80% from the Good Times average in 2004-2005:
Enjoy reading WOLF STREET and want to support it? You can donate. I appreciate it immensely. Click on the beer and iced-tea mug to find out how:

Would you like to be notified via email when WOLF STREET publishes a new article? Sign up here.
![]()
[ad_2]
Source link
What should the Fed (and Congress) do now?

Russia bans SWIFT — RT Business News