Silver Takes the Lead
Disclaimer: Your capital is at risk. This is not investment advice.
Atlas Pulse Gold Report, Issue 85;
Most precious metals analysts would broadly expect gold and silver to end up in roughly the same place over the long term, but silver would get there with more sleepless nights. So why bother? The answer is that when silver is undervalued, as it currently is, there is the opportunity for a catch-up rally. Not only that but under the right conditions, it will overshoot.
Highlights
| Silver | It’s Gold on Crack |
| Silver Deficit | Solar Panels |
| Macro | Unaffordable Houses |
Silver Is Gold on Crack
I don’t know who said it first, but I heard it from John Levin around the time of the credit crisis in 2008. John is one of the great gold traders who once worked at HSBC but moved home to Sydney and now heads the team at ANZ. His life ambition is to trade every single ounce of gold that has ever been mined. I’m not sure where he is with that.
His “gold on crack” comment humorously described silver’s excess volatility in comparison to gold’s, which is generally twice as high. Anyone familiar with trading silver versus gold immediately got the joke. Despite great hope, silver’s additional volatility has not led to higher returns, reminding us that more risk does not always result in more reward.
Most precious metals analysts would broadly expect gold and silver to end up in roughly the same place over the long term, but silver would get there with more sleepless nights. So why bother? The answer is that when silver is undervalued, as it currently is, there is the opportunity for a catch-up rally. Not only that but under the right conditions, it will overshoot.
The Gold to Silver Ratio (GSR) measures the price difference between gold and silver. It is currently 79, which means one ounce of gold could be swapped for 79 ounces of silver. Just to be difficult, I will invert the chart to become the Silver to Gold Ratio (SGR). One ounce of silver is worth 0.013 ounces of gold, which is the reciprocal. The SGR is useful because when the SGR line is going up, silver is outperforming gold. That makes it easier to interpret the chart.
Silver Is Cheap Gold
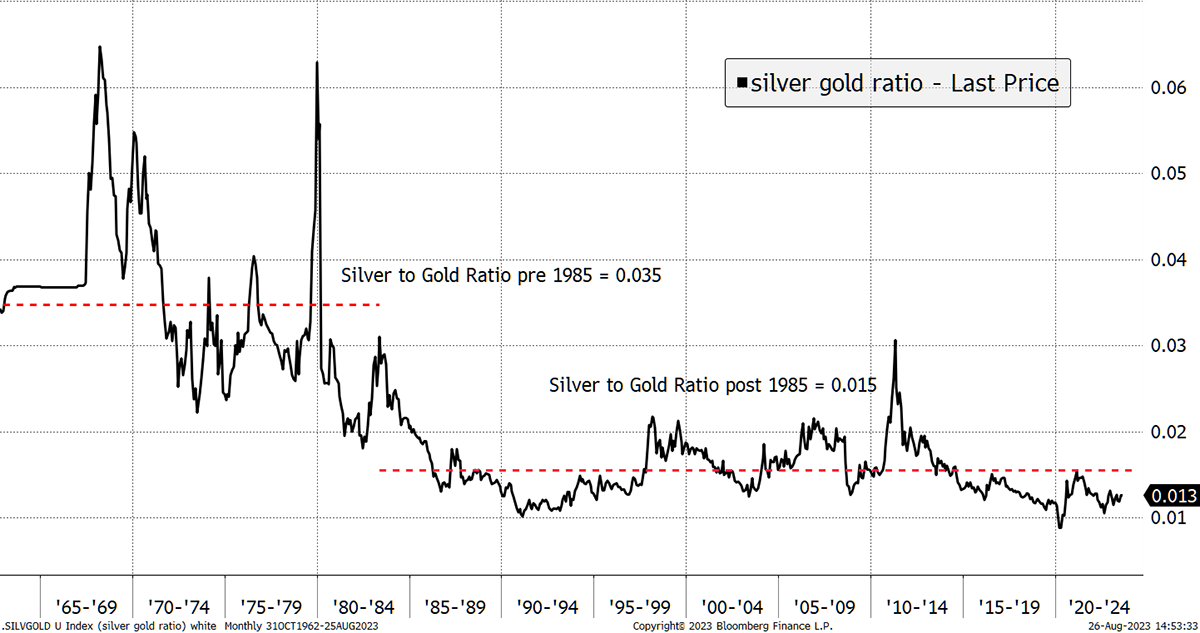
In the 1970s, which was a high inflation era, the average SGR was more than twice the level post-1985. Going back to the 12th century, the SGR ratio was 0.08 (GSR of 12). In the 18th century, the physicist Isaac Newton set the rate at 0.06 (GSR of 15) while he was running the Bank of England. In addition, there are claims that the SGR touched 0.4 (GSR of 2.5) in ancient Egyptian times. The bottom line is that silver has been derated relative to gold in the long run, but that doesn’t mean it couldn’t reverse from time to time.
Silver was most likely to be overvalued in the 1960s because it was trading as a gold proxy when the gold price was fixed under the gold standard. Silver’s surge in the late 1960s was in preparation for the end of the Gold Standard in 1971, when that value would become realized as gold was set free.
As gold transitioned from being at the heart of the formal monetary system, it surged in the inflationary 1970s only to settle down post-1980. Thereafter, both gold and silver devalued, but silver had it far worse. Following a $50 peak in 1980, silver slumped to $3.56 by 1993, which was a 92% fall. In contrast, gold fell by 70%.
From the late 1990s, gold played an increasingly important role in the informal monetary system, where it continues to thrive today. You could argue that if gold’s role has been re-established, there ought to be a more elevated subsidiary role for silver, and that’s what the market might be telling us.
In recent weeks, we have seen silver outperform the gold miners, a trend that has been going on for 20 years. Not only that, but as you will see, the silver market is in deficit, and the price remains firm despite selling pressure from investors.
Silver Leads the Miners
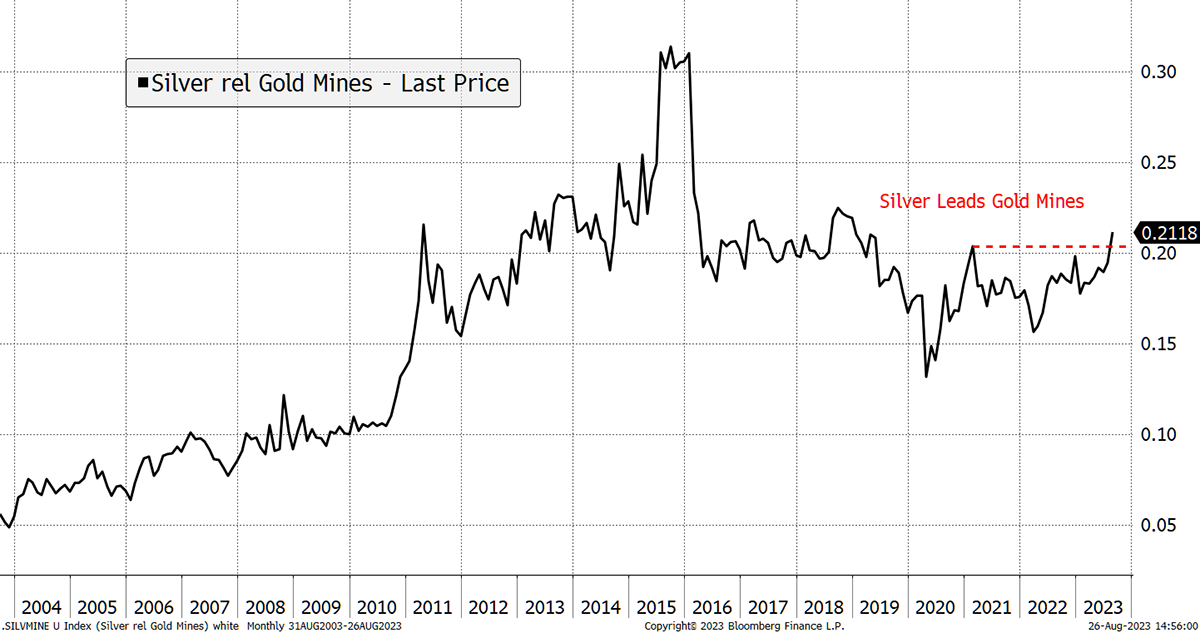
A strong price is one thing, but it isn’t a bubble by any means because investors have been dumping silver for the past two years. Indeed, their holdings are not much higher than they were in 2011 when the price last touched $50. Considering what has been happening in financial markets over the past decade, with the surge in the money supply, the price of silver has been remarkably subdued. Many blame Bitcoin for taking the limelight that would otherwise have benefited silver.
Silver Price Shrugs off ETF Selling
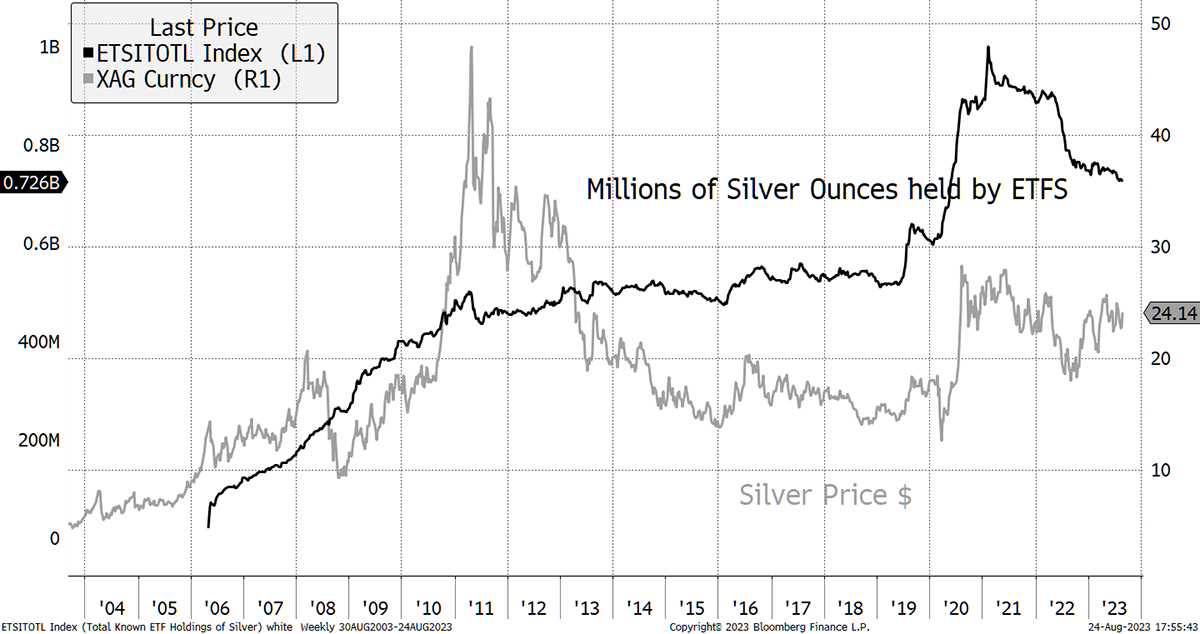
What’s interesting about the chart above is how the silver ETFs accumulated 500 million ounces of silver pre-2011, which coincided with the near 10x price surge. That levelled off until 2020, only to rise in the post-pandemic environment.
There was an attempt to lift silver alongside meme stocks such as GameStop (GME) and crypto. The silver price managed to touch $30 but failed to break higher. The surge in the silver ETFs occurred in February 2021 and was mainly in the US-based iShares Silver Trust (SLV). The money soon left, and once again, the gold and silver aggregate ETF holdings are back in line.
Gold and Silver ETF Holdings (rebased to 100)
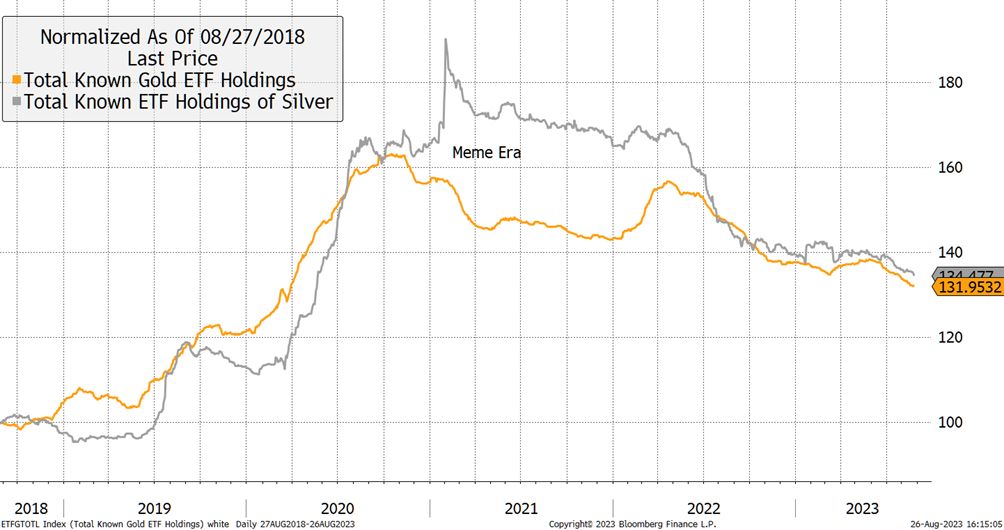
Today, there is no meme craze, and the ETFs are experiencing outflows. That makes the current price action in silver quite impressive. The price remains firm while there is external selling pressure from investors.
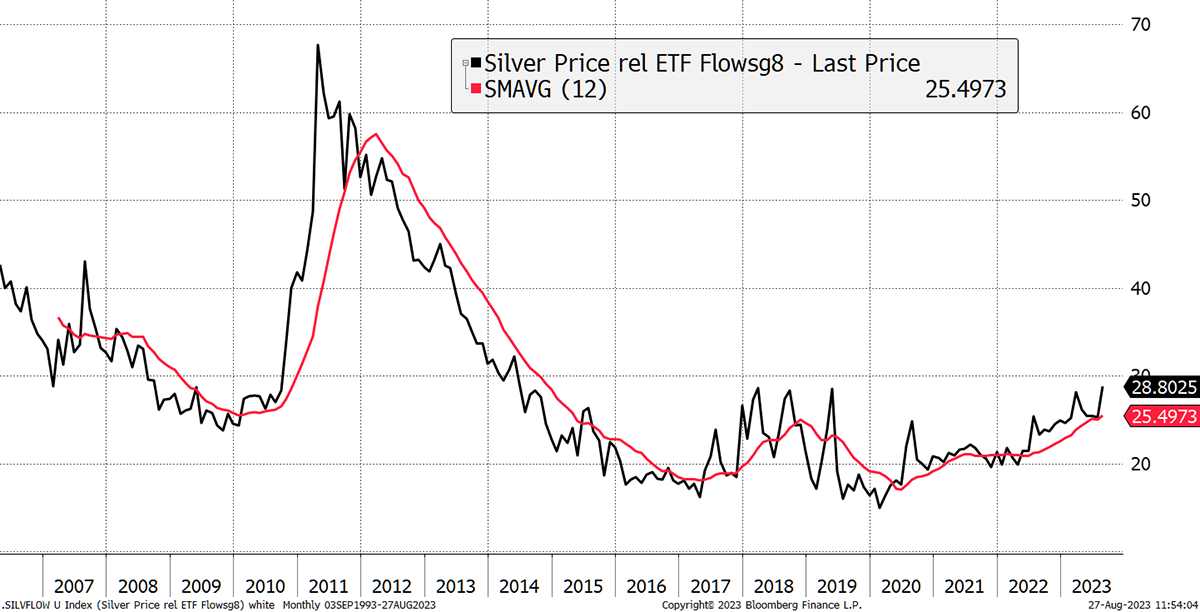
Better still, the silver price divided by the flows gives a sense of when the market is tight or not. In 2010/11, it was extremely tight, and so marginal purchases of the silver ETFs had an outsized positive impact on price. That faded in 2012, but it appears to be back with a vengeance. The bottom line is that it would be a good time for investors to catch the silver bug because they are likely to get rewarded.
The Silver Market Tightens
For this opportunity to be realized, we would need a period of uncertainty and inflation, which sounds like the world around us. With tech tired from its 2023 rebound, silver could be just the ticket.
Solar Panels
Better yet, the silver market faces the largest deficit for over a decade. The total silver supply (blue) from mines and recycling hasn’t grown for years, while demand (red) has. The result is a market deficit that is expected to continue into next year.
A Deficit in Silver
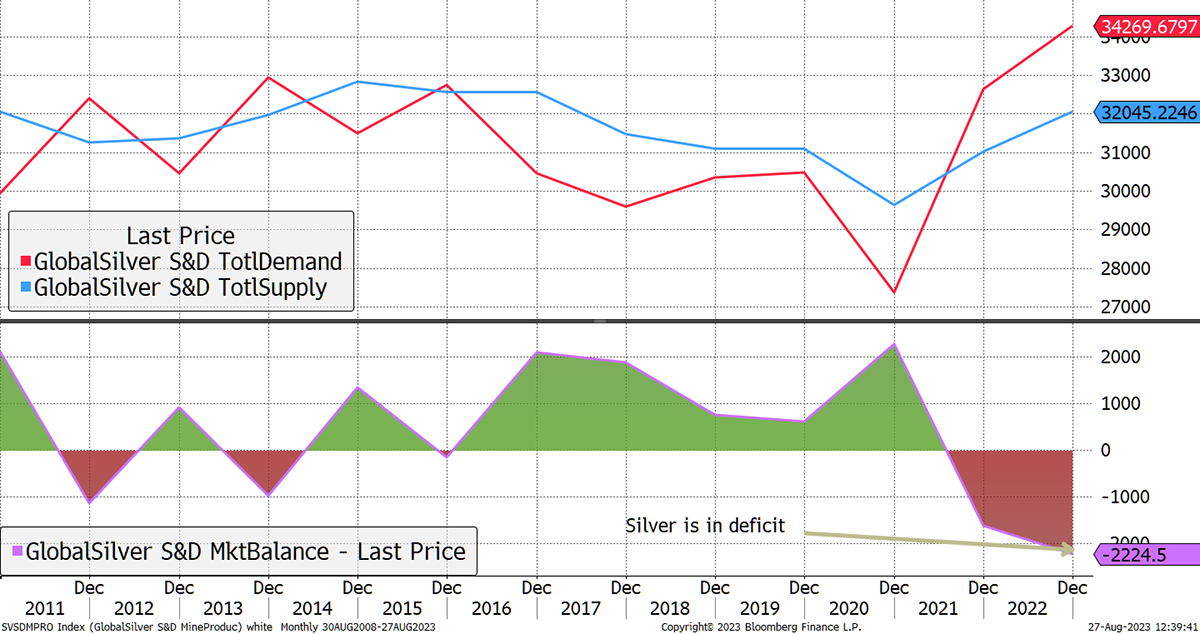
Naturally, all financial markets must balance as buyers and sellers are matched. The reason silver prices haven’t been rising more strongly is because investors have been selling down their ETF holdings.
Over the past decade, mine production has fallen, with the real story being higher demand. Most of that comes from electronics, with photovoltaics now dominating the sector. The bottom line is that if you think there will be more solar panels over the next decade, then the silver market will remain tight, and that’s the opportunity. If investors were to reverse their silver sales, it wouldn’t be difficult to see silver challenge $50 for the third time.
Silver’s Third Attempt at $50
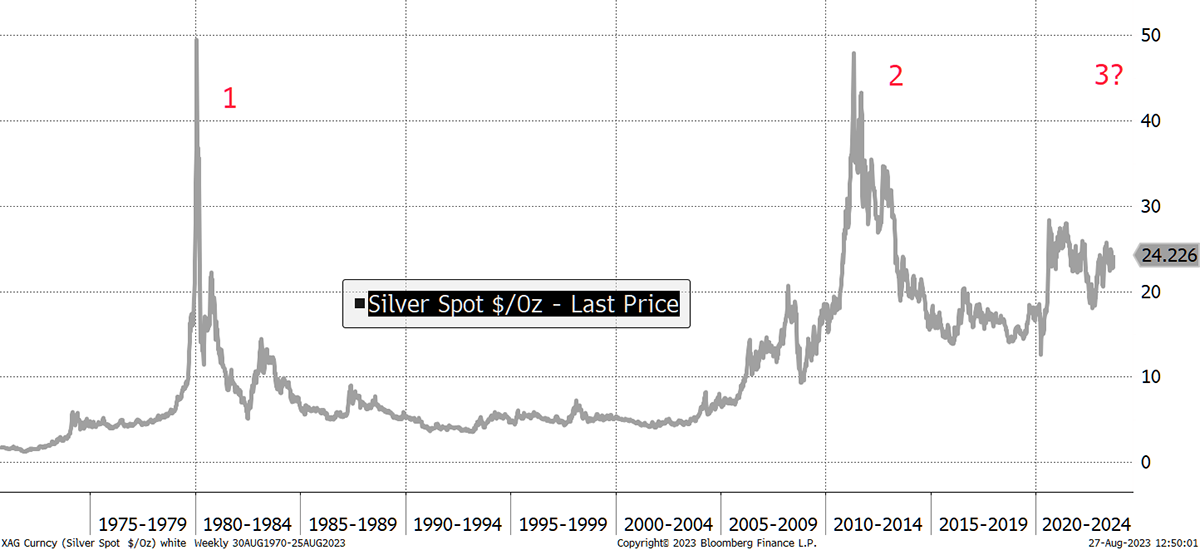
At $24, silver is cheap gold. All we need to see for the precious metals to rally is a little calming in this absurd monetary tightening. The negative impact on gold and silver prices has been light for the reasons I have laid out in recent issuesof Atlas Pulse. In the main, gold has become the global neutral asset, not that US treasuries have become weaponized.
Unaffordable Houses
In the eyes of many, the carnage in the bond market is seen to be a reason to buy real assets, such as gold and silver, rather than take the signal that monetary conditions will remain tighter for years to come. The cynics believe the rate hikes are unsustainable, and when the economy feels the pain, the money printers will be spurned back into action. That is unsurprising in a market that has witnessed 25 years of money printing to solve all problems.
Here is an example of the carnage around us. The red line shows the interest rate on a new US 30-year mortgage, which has surged over the past two years. Yet house prices have barely fallen (black), which makes the green line on the lower chart frightening. That multiplies the rate against the average house price, a measure of how much a house costs a normal person.
Unaffordable Houses
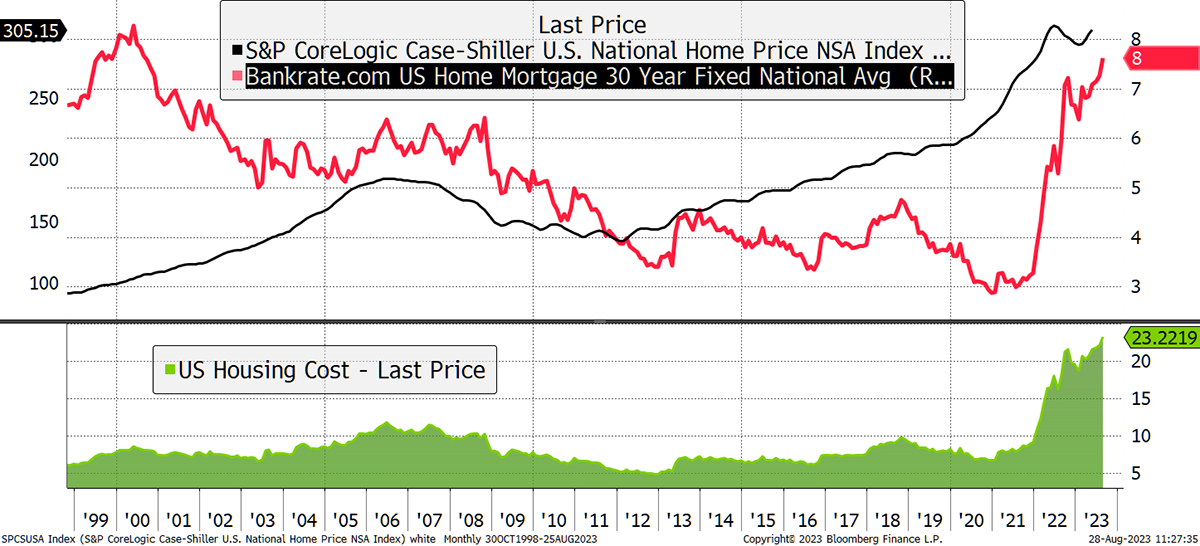
In 2007, just before the crisis, this touched 11.4, having risen from 6 in 1998. It eased back to 5 by 2012, yet today is 23.2. This is extraordinarily tight for the housing market, and it seems implausible that another collapse doesn’t follow.
This is one of many examples of what could go wrong. And this isn’t China; it’s the US, which is seen to be the most stable market of them all.
Physical Gold and Silver
If you are interested in buying physical gold or silver, my recommended bullion dealer is The Pure Gold Company. You can take delivery of your metal in the UK, US, Canada and Europe or leave it in their safe custody. The trading costs are low, while the quality of service is high, as shown on Trustpilot. For more details on The Pure Gold Company, please visit their website.
Summary
In this piece, I have highlighted how silver is trading as cheap gold. The Silver to Gold ratio is below average, and that average has the potential to rise if inflation persists. The market is tight because less silver is mined, while there is record demand for solar. If investors weren’t selling, silver prices would probably already be higher.
The risk in the long run is substitution. In commodities, this is always a threat, as high silver prices will cause the scientists to find cheaper substitutions, but that takes time. Not only that, but if solar prices double, sales will fall. It is as simple as that.
But silver isn’t just a solar panel; it’s a precious metal that is historically undervalued at a time when gold has become established in an important new role. That puts silver into the sweet spot.
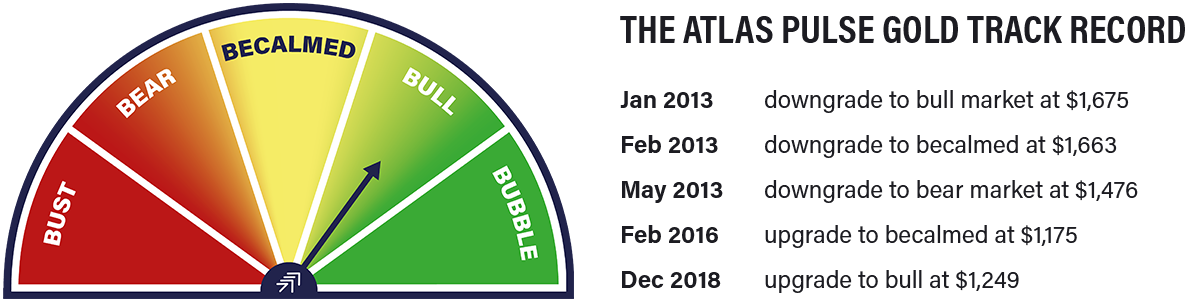
The Gold Dial Remains in Bull Market.
I have been writing Atlas Pulse since October 2012. If you wish to receive the next issue of Atlas Pulse ahead of the rest, then subscribe here.
[ad_2]
Source link

IRS Under Biden Taxing Americans More Than Trump