The Most Splendid Housing Bubbles in America, August Update: 4th YoY Price Drop Overall, 10 of 20 Cities with YoY Drops. Month-to-Month, Selling Season Begins to Fade
Year-over-year price drops in San Francisco, Seattle, Las Vegas, Phoenix, Denver, Portland, Dallas, San Diego, Los Angeles, and Tampa suddenly.
By Wolf Richter for WOLF STREET.
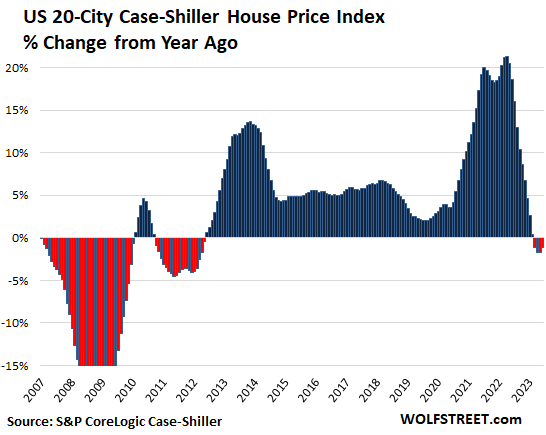
Today’s S&P CoreLogic Case-Shiller Home Price Index for “June” is a three-month moving average of home prices whose sales were entered into public records in April, May, and June, and it still shows the seasonal effects of spring selling season, when prices typically rise on a month-to-month basis, but the effects began to fade, and the index rose month-to-month at a much slower rate (+0.9%) than in the prior three months of spring selling season (+1.5% to +1.7%).
Year-over-year, the Case-Shiller index fell 1.2%, the fourth month in a row of declines, and the biggest and only declines since the end of the Housing Bust.
By contrast, the National Association of Realtors’ median-price index for July has already been released, and for July, it shows the first month-to-month dip in home prices after spring selling season, amid plunging sales. June 2022 had been the peak in the NAR’s index. The Case-Shiller index lags the NAR’s median-price index by a couple of months.
Of the 20 metros in the index, 10 had year-over-year declines:
- San Francisco Bay Area: -9.7%
- Seattle: -8.8%
- Las Vegas: -8.2%
- Phoenix: -7.5%
- Denver: -4.4%
- Portland: -4.2%
- Dallas: -4.1%
- San Diego: -2.5%
- Los Angeles: -1.8%
- Tampa: -0.9%
Of the 20 metros in the index, 10 set new highs (YoY %):
- Minneapolis: +0.7%
- Washington DC: +0.6%
- Boston: +0.9%
- Charlotte: +1.7%
- Atlanta: +2.1%
- Detroit: +2.2%
- Miami: +2.5%
- New York: +3.4%
- Cleveland: +4.1%
- Chicago: +4.2%
The most splendid housing bubbles by metro.
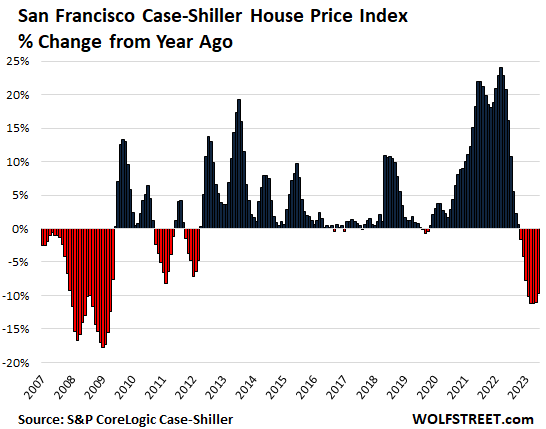
The San Francisco Bay Area:
- Month to month: +0.1%.
- From the peak in May 2022: -10.9%.
- Year over year: -9.7%.
This was the 8th month in a row of year-over-year declines. Note the waves of declines interrupted by increases during Housing Bust 1, which is typical for year-over-year metrics due to the “base effect,” and didn’t mean that the Housing Bust was over:
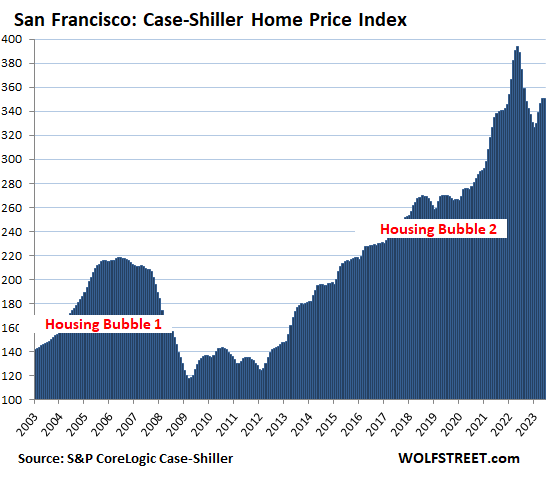
And San Francisco’s most splendid Housing Bubble in its full glory:
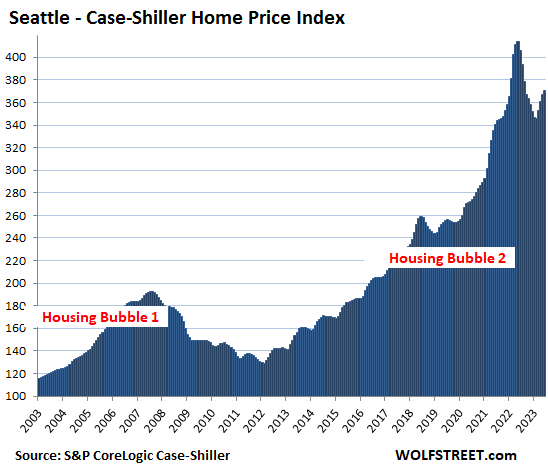
Seattle metro:
- Month to month: +0.8%.
- From the peak in May 2022: -10.5%.
- Year over year: -8.8%.
This was the seventh year-over-year decline in a row:
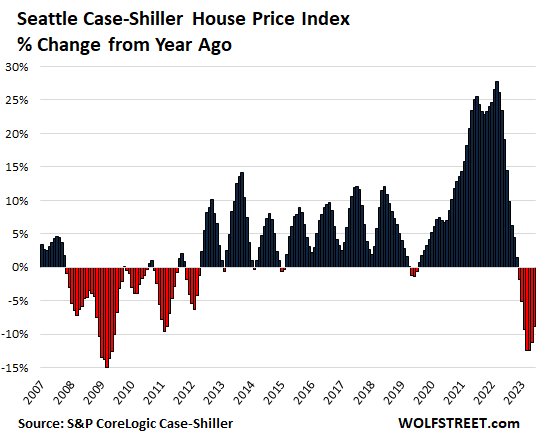
And Seattle’s most splendid Housing Bubble:
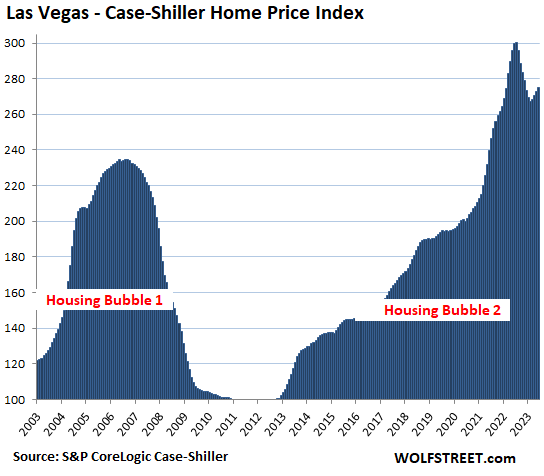
Las Vegas metro:
- Month to month: +0.9%.
- From the peak in July 2022: -8.2%.
- Year over year: -8.2%
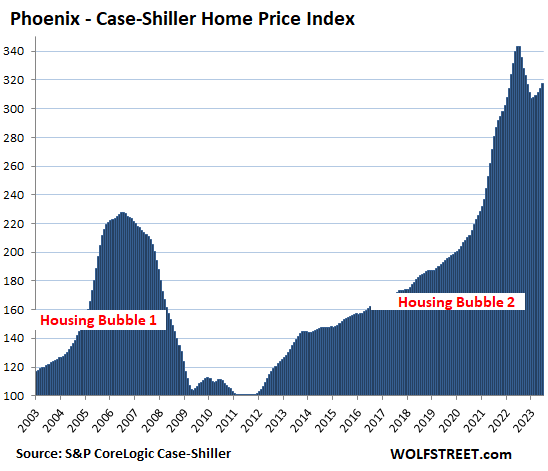
Phoenix metro:
- Month to month: +1.1%.
- From the peak in June: -7.5%.
- Year over year: -7.5%
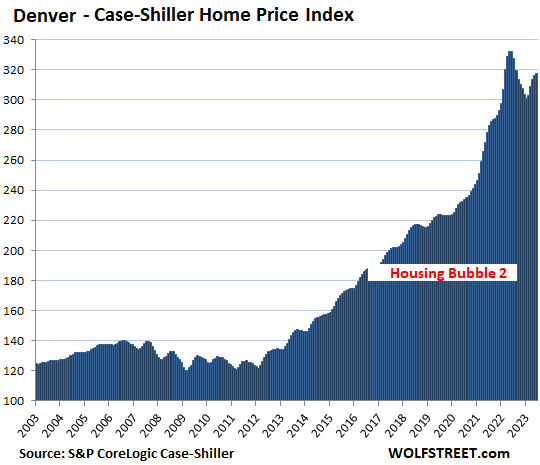
Denver metro:
- Month to month: +0.4%.
- From the peak in May 2022: -4.5%.
- Year over year: -4.4%.
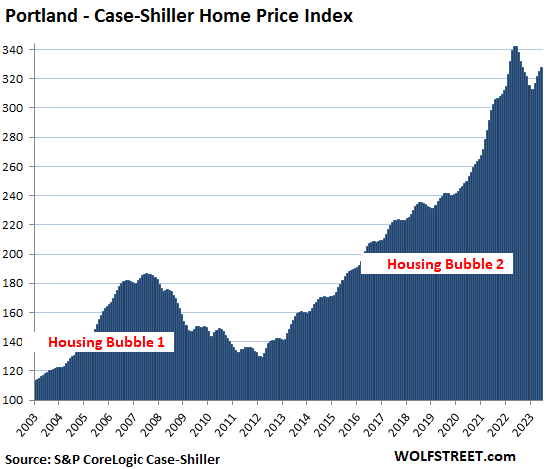
Portland metro:
- Month to month: +0.8%.
- From the peak in May 2022: -4.3%.
- Year over year: -4.2%.
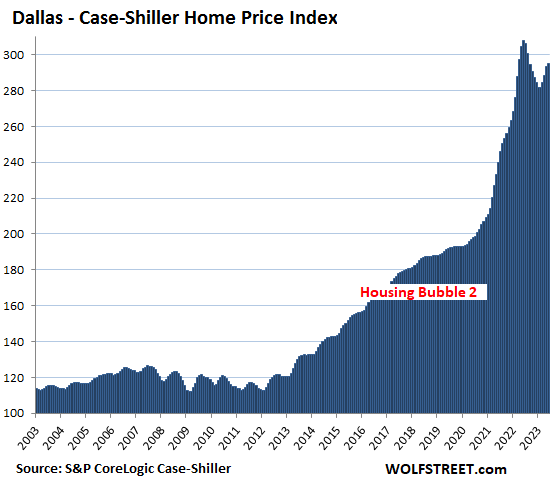
Dallas metro:
- Month to month: +0.7%.
- From the peak in June 2022: -4.1%.
- Year over year: -4.1%
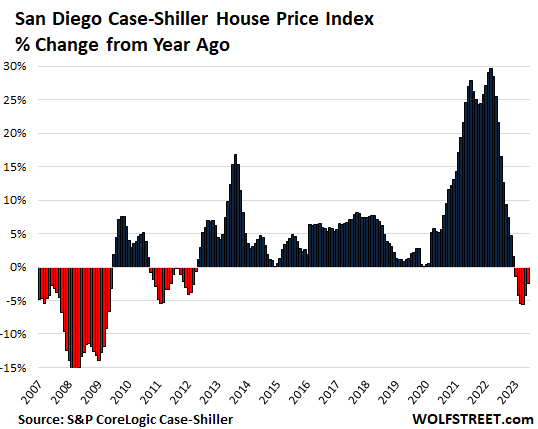
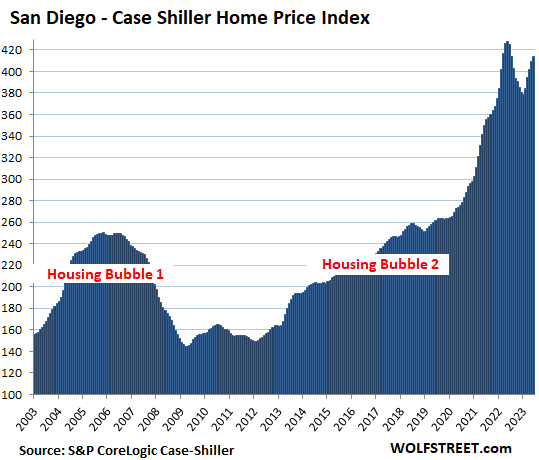
San Diego metro:
- Month to month: +1.1%.
- From the peak in May 2022: -3.2%.
- Year over year: -2.5%.
This was the sixth month in a row of year-over-year declines:
And San Diego’s most splendid Housing Bubble:
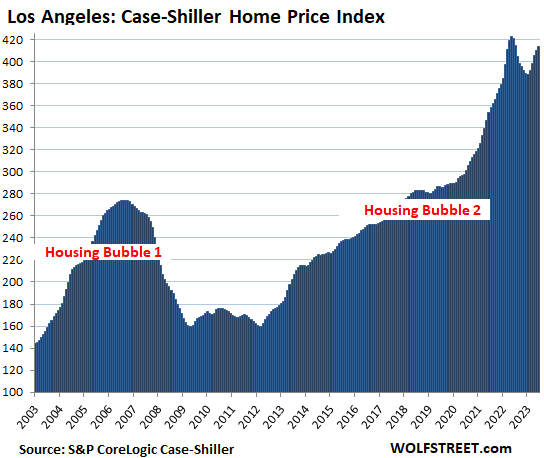
Los Angeles metro:
- Month to month: +0.9%.
- From the peak in May 2022: -2.3%.
- Year over year: -1.8%.
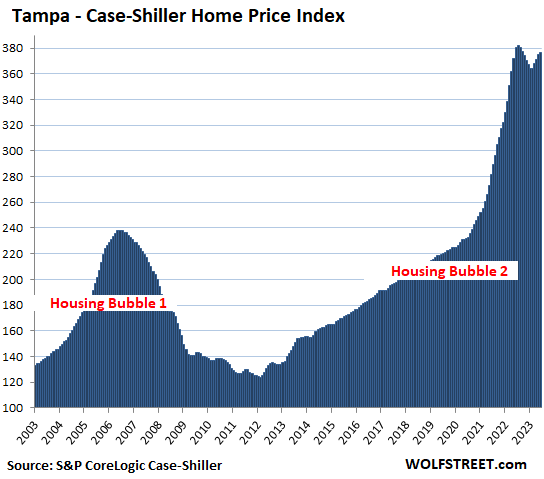
Tampa metro:
- Month to month: +0.5%.
- From peak in July 2022: -1.5%
- Year over year: -0.5% (first month of year-over-year declines).
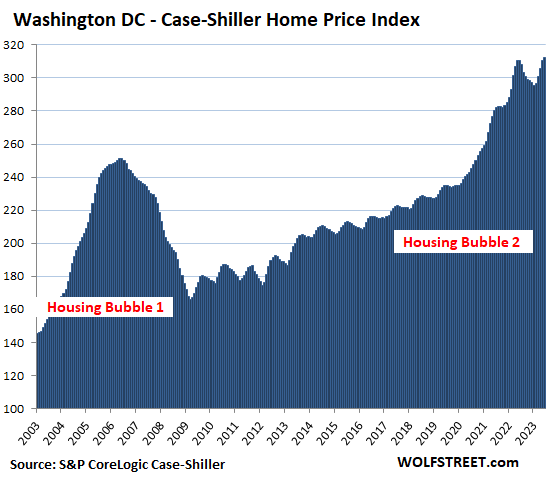
Washington D.C. metro:
- Month to month: +0.7%.
- Set new high in June 2023.
- Year over year: +0.6%
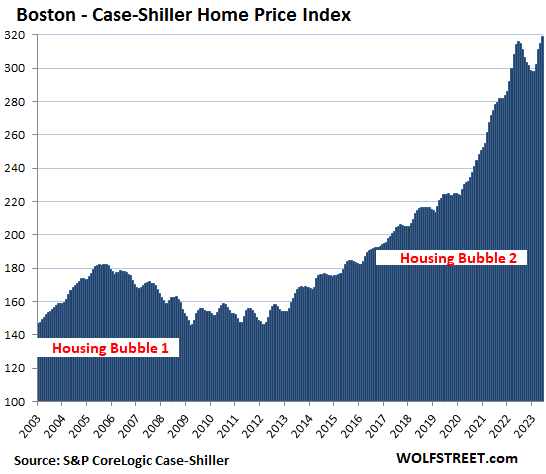
Boston metro:
- Month to month: +1.3%.
- Set new high in June 2023.
- Year over year: +0.9%
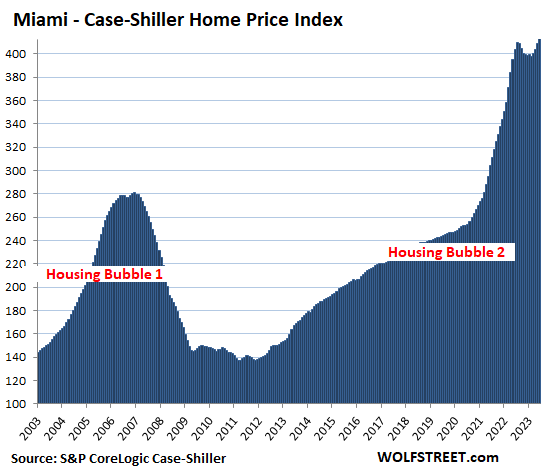
Miami metro:
- Month to month: +1.4%
- Set new high in June 2023.
- Year over year: +2.5%
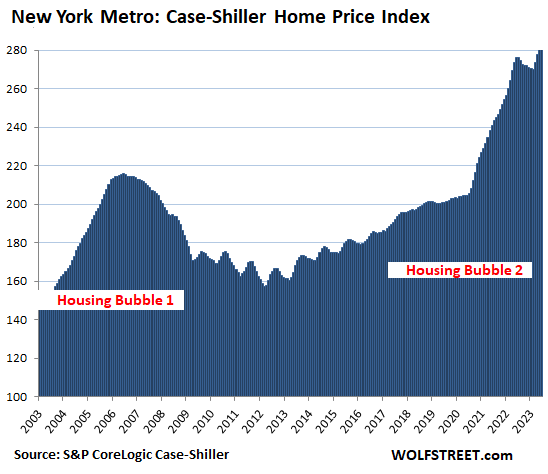
New York metro:
- Month to month: 1.1%.
- Set new high in June 2023.
- Year over year: +3.4%
The Case-Shiller indices were set at 100 for the year 2000. Miami’s and San Diego’s index values of 414 today are up by 314% since 2000. This makes Miami and San Diego share the spotlight of the #1 Most Splendid Housing Bubbles in terms of price increases since 2000, followed by Los Angeles.
Methodology. The Case-Shiller Index uses the “sales pairs” method, comparing sales in the current month to when the same houses sold previously. The price changes are weighted based on how long ago the prior sale occurred, and adjustments are made for home improvements and other factors. This “sales pairs” method makes the Case-Shiller index a more reliable indicator than median price indices, but it lags months behind.
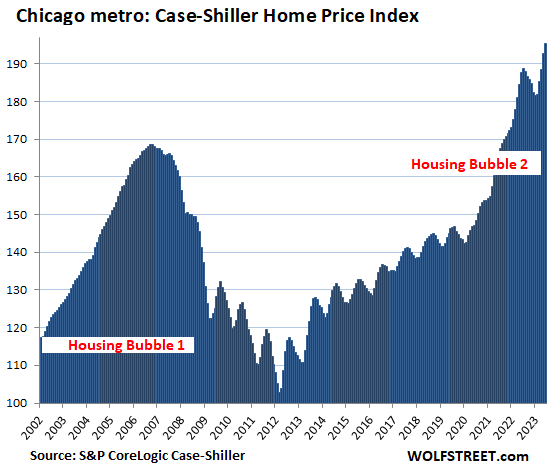
The remaining six of the 20 markets in the Case-Shiller index (Chicago, Charlotte, Minneapolis, Atlanta, Detroit, and Cleveland) have experienced far less house price inflation since 2000, and don’t qualify for this list of the Most Splendid Housing Bubbles.
OK, Chicago anyway.
- Month to month: 1.1%.
- Set new high in June 2023.
- Year over year: +4.2%
Chicago’s index value of 195 is up by 95% from 2000 – nearly doubling in 20 years. While this is still a huge increase, the increase is 90 percentage points smaller than the smallest increase on the list of the Most Splendid Housing Bubbles, the New York metro, whose index increased by 185% in 20 years. And so Chicago doesn’t qualify for a spot on this list of the most splendid Housing Bubbles in America. But it’s trying for sure:
Enjoy reading WOLF STREET and want to support it? You can donate. I appreciate it immensely. Click on the beer and iced-tea mug to find out how:

Would you like to be notified via email when WOLF STREET publishes a new article? Sign up here.
![]()
[ad_2]
Source link

UK Sleepwalking Into Food Crisis As Fresh Produce Set To Vanish From Supermarkets

JPMorgan Chase Earnings Show Economy Is Resilient, but Jamie Dimon’s ‘Hurricane’ Looms