Debt to GDP Alarm Bells Ring, Neither Party Will Solve This – MishTalk
US Debt held by the public is soaring out of sight. It’s even worse than it looks for reasons I explain.
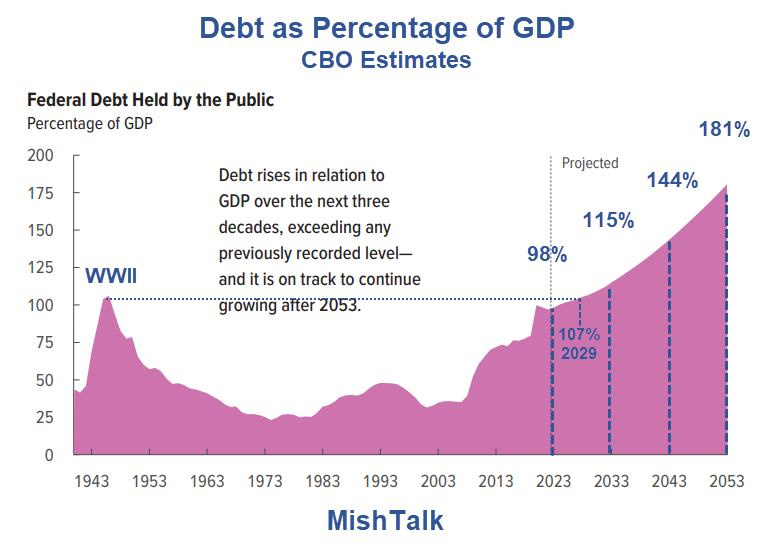
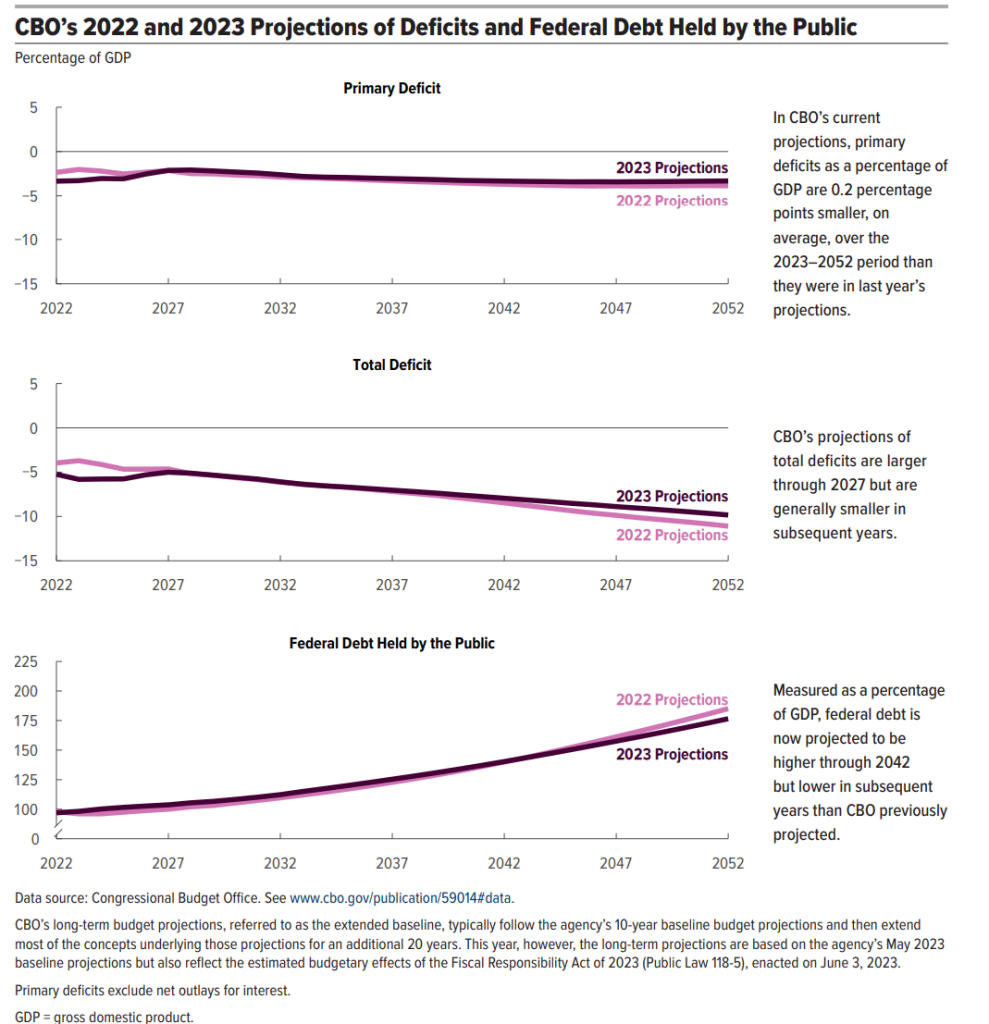
Within a few years the debt-to-GDP ratio of the US will topple highs set in WWII. This time, there will not be a huge baby boomer led recovery.
Deficit Set to More Than Double from 2022
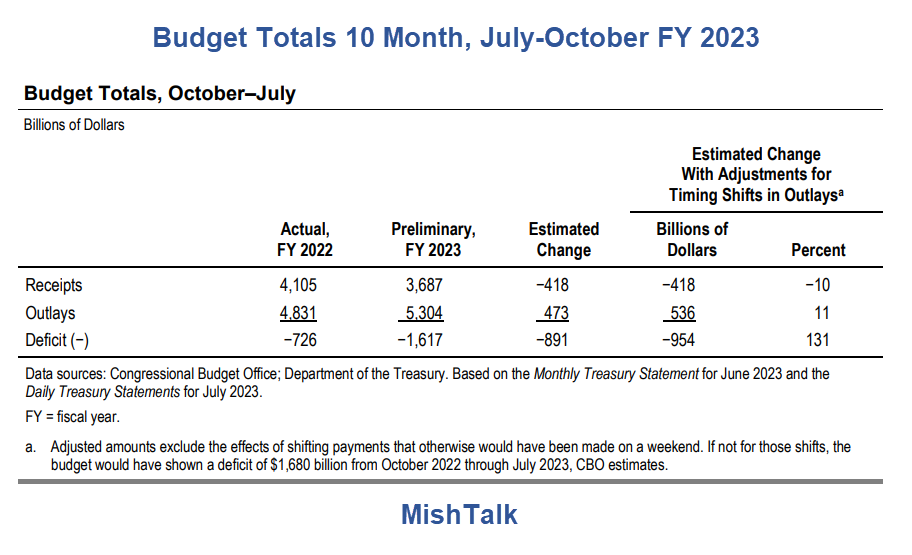
The above image is from the CBO Monthly Budget Review: July 2023
The federal budget deficit was $1.6 trillion in the first 10 months of fiscal year 2023, the Congressional Budget Office estimates—more than twice the shortfall recorded during the same period last year. Revenues were 10 percent lower and outlays were 10 percent higher from October through July than they were during the same period in fiscal year 2022.
Outlays in the first 10 months of fiscal year 2023 were $5.3 trillion, $473 billion (or 10 percent) more than during the same period last year, CBO estimates. If not for the shifts in the timing of certain payments, outlays so far in fiscal year 2023 would have been $536 billion (or 11 percent) more than during the same period in fiscal year 2022.
The lead chart and discussion that follows are from the 64 page 2023 Long-Term Budget Outlook of the CBO.
The long term view is grim. Here are a few more charts.
Population Growth and Demographics
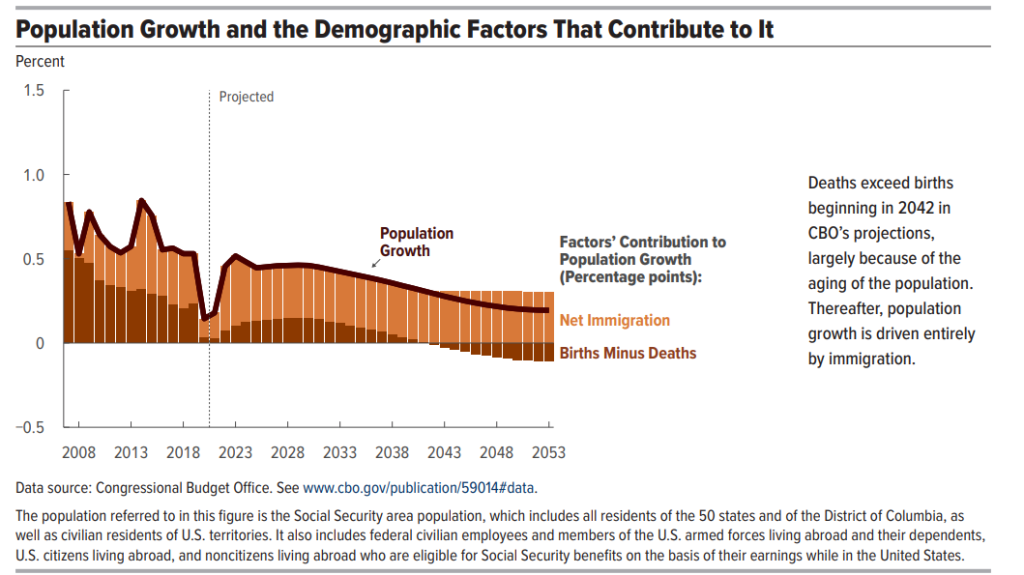
“Deaths exceed births beginning in 2042 in CBO’s projections, largely because of the aging of the population. Thereafter, population growth is driven entirely by immigration.”
Population by Age Group
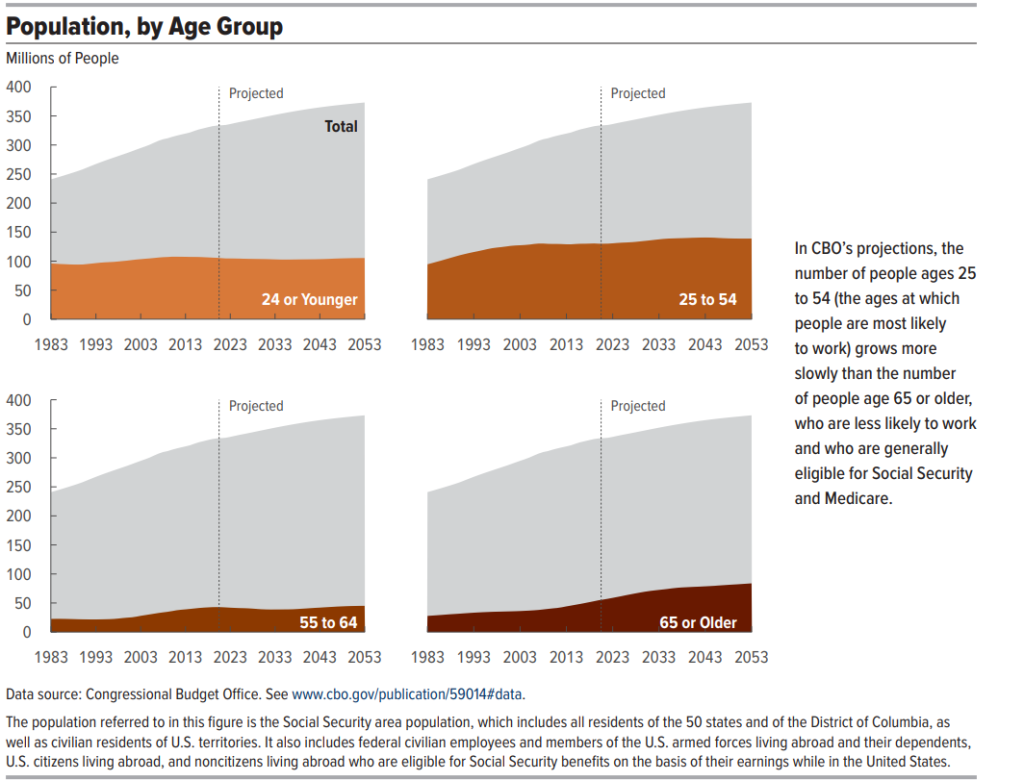
“In CBO’s projections, the number of people ages 25 to 54 (the ages at which people are most likely to work) grows more slowly than the number of people age 65 or older, who are less likely to work and who are generally eligible for Social Security and Medicare.”
As a result, Medicare will take an increasing chunk of deficit spending.
“CBO’s estimation, health care costs per person will continue to rise. The aging of the population also contributes to growth in spending on health care programs and on Social Security. In 2023, outlays for Social Security, Medicare, and Medicaid, for people age 65 or older, amount to less than 30 percent of all federal noninterest spending; but in 2053, such outlays amount to more than 40 percent of all noninterest spending.”
Composition of Outlays for Major Health Care
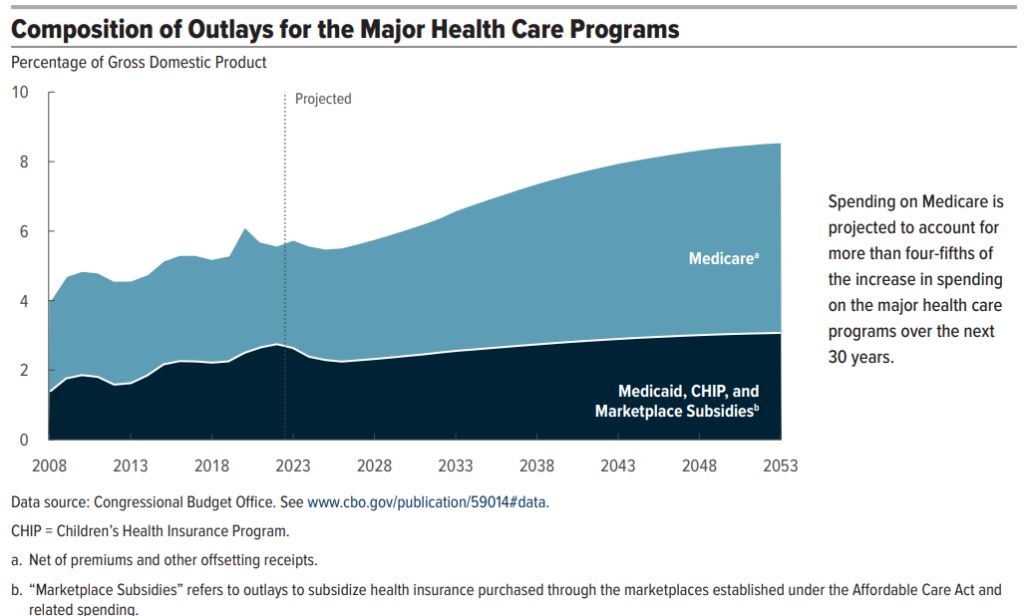
“Spending on Medicare is projected to account for more than four-fifths of the increase in spending on the major health care programs over the next 30 years.”
Composition of Outlays
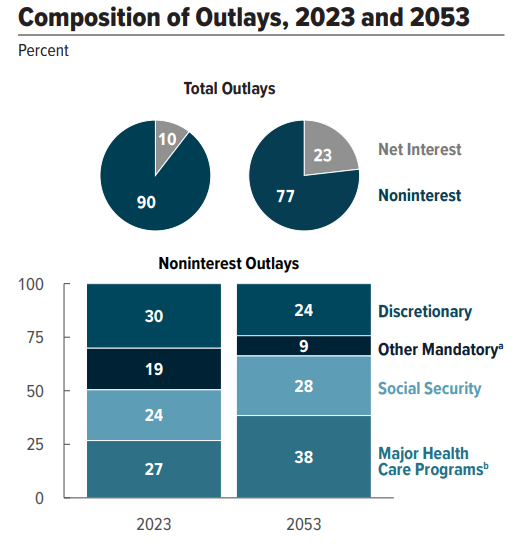
The CBO projects net interest will rise from 10 percent to 23 percent of total outlays.
Major Health Care programs, of which Medicare will comprise about 80 percent, will increase from 27 percent to 38 percent.
The total of Major Health Care and Interest is 23 percent + (38 percent * .77) = 52 percent.
Social Security is another 28 percent * .77 = 22 percent.
That makes the total of Major Health Care + Interest + Social Security 74 percent of total outlays, leaving 26 percent for everything else. Good luck with that.
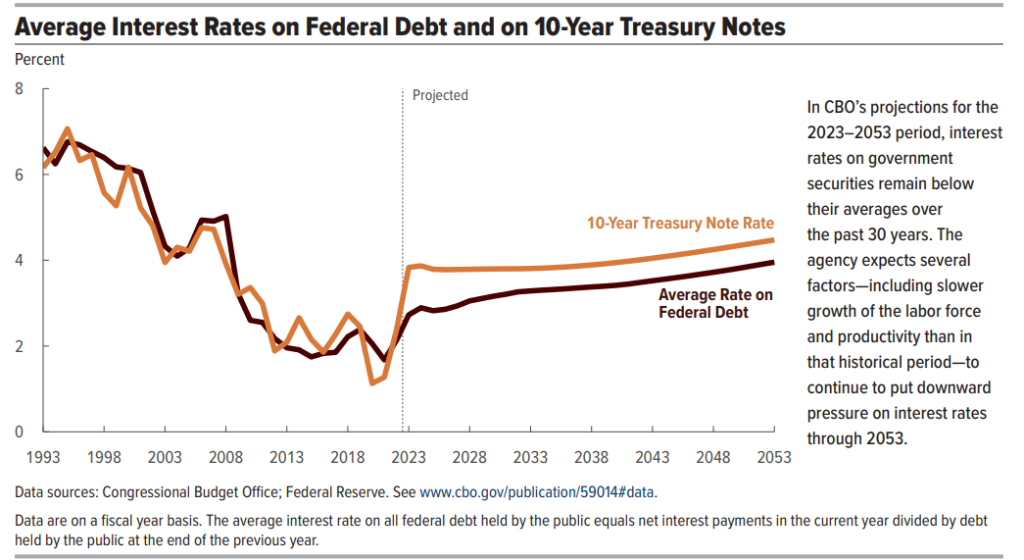
Interest Rates
CBO’s 2022 and 2023 Projections of Deficits and Federal Debt
Major Assumptions and Additional Economic Factors
- Supplemental Nutrition Assistance Program [Snap – Food Stamps] are extended after their authorizations lapse.
- Spending on Medicare and Social Security continues as scheduled regardless of the amounts in those programs’ trust funds.
- Interest rates will remain below average and below the 10-year Treasury Note Rate.
- The unemployment rate generally declines over the 2023–2053 period in CBO’s projections. The unemployment rate averages 4.6 percent over the next decade and falls to 4.1 percent in the third decade.
- The annual growth of Total Factor Productivity (TFP) is projected to average 1.1 percent from 2023 to 2053. That projected growth rate is 0.3 percentage points slower than the average annual rate of growth since 1950 and 0.1 percentage point slower than the average rate since 1990.
- In CBO’s projections, over the next decade, federal discretionary spending measured as a percentage of GDP falls below the levels recorded in past decades.
Those are a sample of some of the major assumptions and additional economic factors. I believe points one and two are a given.
Expect Things to Be Worse Than Projected
No politician will dare touch Social Security or Medicare. The rest are debatable.
If interest rates rise, so will interest spending. The treasury had an opportunity to issue more debt at lower rates and failed.
The major reason to expect things to be worse is the CBO projects no recession and never does. Neither does the Fed. The CBO even upped its near-term projections on many fronts.
When recession does hit, deficits will certainly rise more than projected.
Biden’s Green Energy Inflation Reduction Act Needs a Big Bailout Already
Subsidies we not enough to make Green energy nonsense work.
Note that Biden’s Green Energy Inflation Reduction Act Needs a Big Bailout Already
The Shocking Truth About Biden’s Proposed Energy Fuel Standards
In case you missed it, please consider The Shocking Truth About Biden’s Proposed Energy Fuel Standards
Regarding Recession
Regarding recession, please see Mainstream Media Finally Wakes Up to the GDP vs GDI Recession Discrepancy
No One Will Fix This
Compromise is always more spending for this in return for more spending on that.
Bnd both parties want to spend more on the military.
“Neither party will fix the deficits. Neither party will do anything about mounting debt. No one will do anything about anything because the political system is totally broken.” Mish
[ad_2]
Source link
