Fed’s Balance Sheet Liabilities: RRPs Plunge, Reserves Rise after Bank Panic, Currency in Circulation Dips after Pandemic Spike, TGA Gets Refilled
QT’s impact on the Fed’s liabilities, and the massive movements between them.
By Wolf Richter for WOLF STREET.
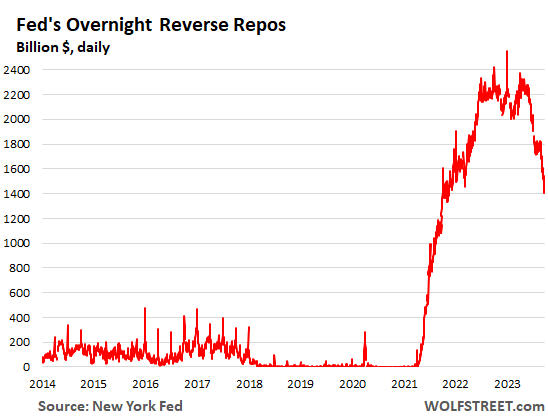
The daily measure of Overnight Reverse Repurchase agreements (ON RRPs) at the Fed have plunged to $1.40 trillion as of Friday. This is down by 45%, or by $1.152 trillion, from the one-day-wonder peak on December 31, 2022.
Under these RRPs, the Fed takes in cash and hands out collateral (Treasury securities). RRPs are a liability for the Fed because they’re cash that the Fed owes its counterparties. The counterparties are mostly US money market funds, but also banks, and government-sponsored enterprises (Federal Home Loan Banks, Fannie Mae, Freddie Mac, etc.). These counterparties use ON RRPs to park their extra cash risk-free at the Fed, and earn interest. As of the rate hike in July, the Fed pays them 5.3% in interest.
This 5.3% is less than what the Fed pays banks on their reserve balances (5.4%), so banks don’t use RRPs much. For money market funds (MMFs), ON RRPs are a good risk-free deal, but they pay a little less interest than Treasury bills (around 5.5%). And MMFs have been yanking their cash out of these RRPs, to load up on T-bills.
Which Money Market Funds?
The Fed started paying interest on RRPs in the spring of 2021, minuscule rates of interest at the time, at first 0.05% APR and then 0.1% APR because policy rates were near 0%. It did so because there was so much liquidity in the financial system as a result of the then still ongoing QE, chasing after everything, that T-bill yields dipped into the negative.
Treasury money market funds that primarily invest in T-bills were threatened by these negative yields; they could cause the MMFs to “break the buck” where the Net Asset Value of the fund drops below $1, which could trigger a run on the fund, forced selling by the fund, the collapse of a fund, contagion from there, etc., etc., you know the financial panic routine. The Fed’s solution was to pay a little interest on RRPs, and MMFs flocked to them, and with each rate hike starting in March 2022, the Fed paid more on RRPs.
In addition, MMFs switched some of their cash that they need for liquidity reasons from their bank accounts to RRPs, since banks paid 0% interest, and even now are stingy with the interest they pay. This shift from banks to RRPs via the MMFs caused the banks’ reserve balances to fall starting when QE ended. More in a moment.
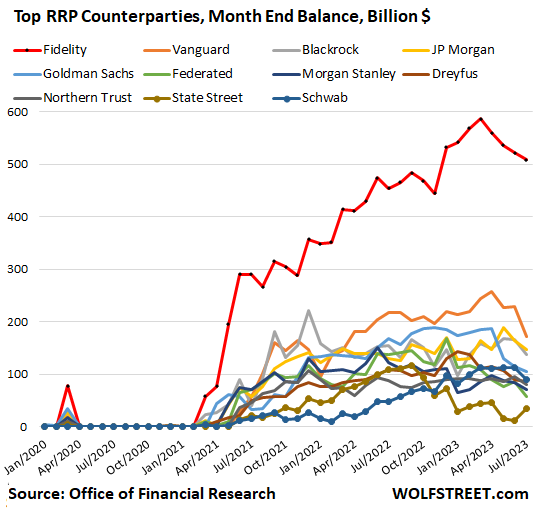
The government’s Office of Financial Research publishes RRP balances by money-market funds on a monthly basis, unfortunately with a big delay. The most recent release was for July 31, by which time MMF participation in RRPs had dropped to $1.75 trillion.
The biggest providers of money market funds lead the list: About 29% of these RRPs were with Fidelity’s funds ($508 billion); 10% were with Vanguard’s funds ($172 billion); 8.4% were with JP Morgan’s funds ($148 billion); and 7.9% were with Blackrock’s funds ($138 billion):
Foreign official RRPs and ON RRPs.
The Fed also offers RRPs to “foreign official” accounts, where other central banks can park their dollar cash.
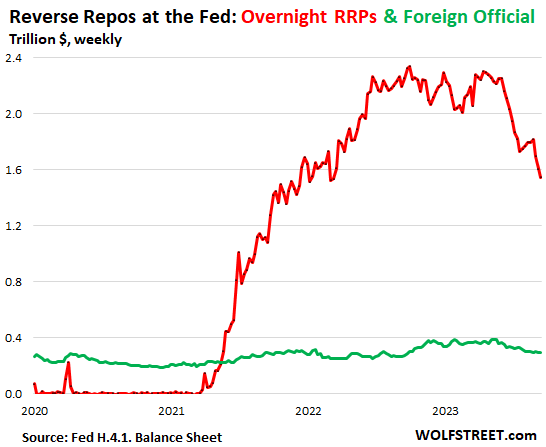
The weekly balance sheet of the Fed – the latest was released Thursday afternoon – shows only balances as of Wednesday every week, not daily balances. So these are balances through Wednesday, which have not yet captured the las two days of the plunge in RRPs.
Foreign official RRPs dropped to $289 billion, down by $94 billion, or by 25%, from the peak in January 2023 (green line).
The chart also shows the ON RRPs (red line) as of Thursday’s balance sheet ($1.546 trillion). Since then, ON RRPs have plunged by another $145 billion, which is reflected in the daily chart above.
Both combined – ON RRPs and foreign official RRPs – have plunged by $803 billion, or by 33%, from the weekly Wednesday peak last September:
Rising/falling reserves & RRPs don’t negate effects of QE/QT. They’re part of those effects.
The fact that liabilities (mainly reserves and RRPs) rose during QE in equal measure with assets did not negate the effects of QE. And the fact that liabilities have fallen during QT in equal measure with assets does not negate the effects of QT. That’s just how a balance sheet works – it always stays in “balance.”
Massive shifts among the liabilities on the Fed’s balance sheet.
Every balance sheet has assets, liabilities, and capital, where: Assets = liabilities + capital. The Fed’s capital is limited by Congress, and it changes only in small ways. But its assets and liabilities change massively.
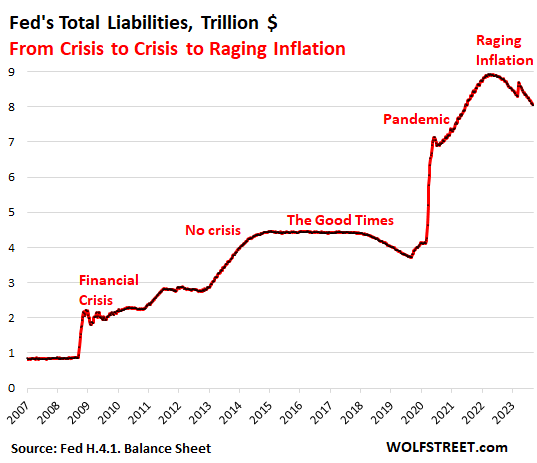
On the asset side of the balance sheet, QT is proceeding at a record pace; the Fed has shed $867 billion in assets since the peak, now down to $8.099 trillion.
On the liabilities-and-capital side, the Fed has shed $868 billion in liabilities since the peak in April, now down to $8.056 trillion; and it increased its capital by $1 billion to $43 billion.
But there have also been massive shifts between liabilities, with some rising and others falling that we’ll get to in a moment.
The four major liabilities:
- RRPs (discussed above)
- Reserves
- Currency in circulation (paper dollars)
- Treasury General Account (TGA), the government checking account.
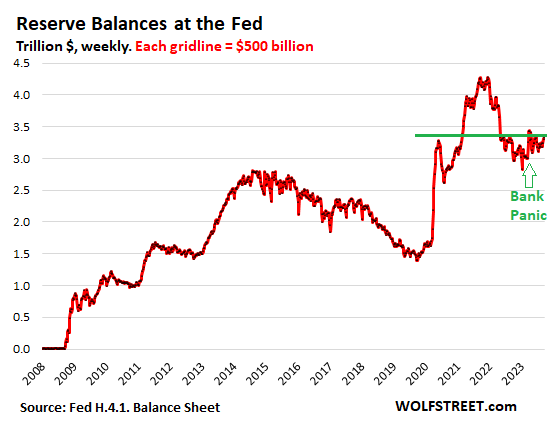
Reserves: $3.33 trillion, -$940 billion since Dec 2021 peak. But +$337 billion since the March bank panic.
Reserves are cash that banks put on deposit at the Fed, and are a form of instant liquidity in the banking system. Reserves are a liability on the Fed’s balance sheet because the Fed borrowed this cash from the banks. Since the rate hike in July, the Fed pays banks 5.4% in interest on their reserve balances.
Banks, on their own balance sheets, don’t call them “reserves,” but “interest-earning cash,” or similar. They’re assets for the banks. They use their reserve accounts at the Fed to transfer cash between banks, to do business with the Fed, to have liquid cash available when needed, and to earn 5.4% interest.
Reserves have risen since the bank panic in March, after falling sharply for the prior 15 months.
QT is draining liquidity from the financial system, and reserves are one place where the drainage showed up. But the March bank panic – Silvergate Capital, Silicon Valley Bank, Signature Bank, and First Republic toppled – caused banks to increase their liquidity, and they put some of this cash on deposit at the Fed as reserves.
QE ended in March 2022. QT started in July 2022. Note the sharp drop in reserves from December 2021 until the March 2023 bank panic, and then cash started flowing back into reserves:
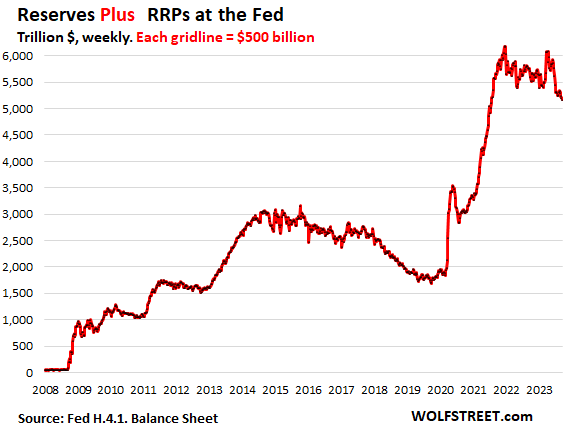
Reserves plus RRPs: $5.17 trillion; -$1.01 trillion from Dec 2021 peak.
Since there are big shifts of cash between reserves and RRPs via the MMFs, it makes conceptual sense to look at them together to see the combined amount of liquidity that is getting drained out of the financial system via QT.
The pandemic-era QE had inflated the combined total of Reserves plus RRPs by $4.2 trillion, to $6.18 trillion in December 2021.
Since that peak, the combined balance of RRPs and reserves has dropped by $1.01 trillion, or by 16%, to $5.17 trillion
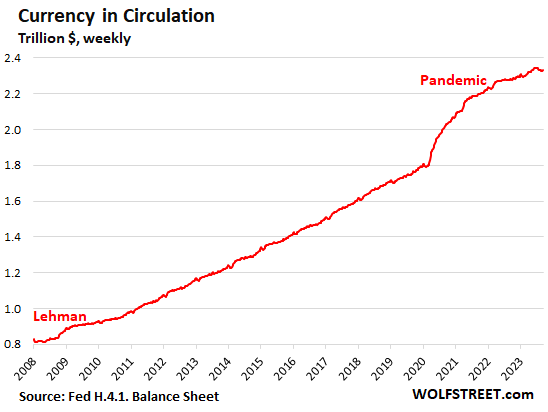
Currency in circulation dipped to $2.33 trillion.
Currency in circulation reflects the paper dollars in wallets, under mattresses, and in safes in the US and globally. Various studies show that the majority is overseas.
The amount of currency in circulation is demand-based through the US banking system. If customers demand paper dollars, the banking system must have enough on hand. Foreign banks have relationships with US banks to get dollars for their customers.
These “Federal Reserve Notes,” as they’re called, are a liability for the Fed. Banks get those paper dollars from the Fed in exchange for collateral, such as Treasury securities, which are assets on the Fed’s balance sheet.
That’s one reason why the Fed’s assets increase when there is no QE and no QT: demand for currency must be met by banks, and in return banks must post collateral at the Fed for those amounts, which are assets for the Fed, and its assets rise in part with the rise of currency in circulation.
Before QE, currency in circulation was the primary driver of the increase in assets on the Fed’s balance sheet through the collateral (Treasury securities, etc.) that banks have to post to get these paper dollars.
Currency as payment methods for legitimate purchases is increasingly being replaced by electronic payment systems (credit cards, debit cards, ACH, Zelle, PayPal, etc.). But demand for currency was huge during the pandemic. When there is fear of a crisis, demand for paper dollars surges: before Y2K, after the Lehman bankruptcy, and massively starting in early 2020.
Demand for currency in circulation has now stabilized, as some people return their paper dollars to the bank to then earn 5% interest on their electronic dollars.
Since the peak in early June, currency in circulation has dipped by $14 billion, to $2.33 trillion.
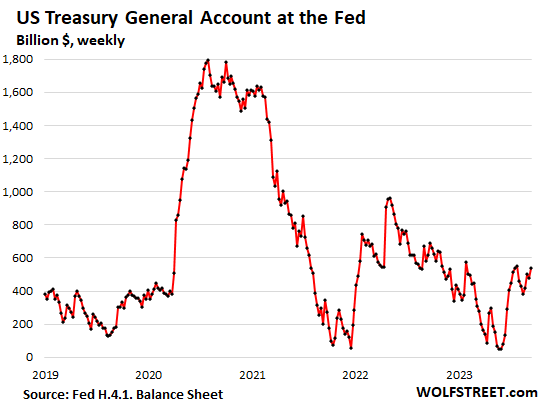
Treasury General Account (TGA): $537 billion.
The Treasury Department is unleashing a tsunami of new Treasury notes and bonds to fund the government deficits and to raise the balance of the TGA account, the Treasury Department’s checking account a the Fed.
The amount in the TGA account is a liability for the Fed – money that the Fed owes the government.
The Treasury Department said that it wants to end Q3 with $750 billion in the TGA. September 15 was the day estimated taxes were due, and so over the next two weeks, those tax receipts will show up in the TGA and push up the balance. As of the Fed’s balance sheet on Thursday, the amount in the TGA was $537 billion.
Enjoy reading WOLF STREET and want to support it? You can donate. I appreciate it immensely. Click on the beer and iced-tea mug to find out how:

Would you like to be notified via email when WOLF STREET publishes a new article? Sign up here.
![]()
[ad_2]
Source link
DBRS Joins Fitch Placing United States’ AAA Rating On Watch Negative

Gold Tumbles Amid Weaker-Than-Expected U.S. Sanctions on Russia