The Most Splendid Housing Bubbles in America, September Update: Spring Bounce Fades. 20-City Index -0.6% from Peak in 2022, Flat Year-over-Year
San Francisco -11% from peak, Seattle -10%, followed by Las Vegas, Phoenix, Portland, Denver, Dallas, San Diego, Los Angeles, Tampa.
By Wolf Richter for WOLF STREET.
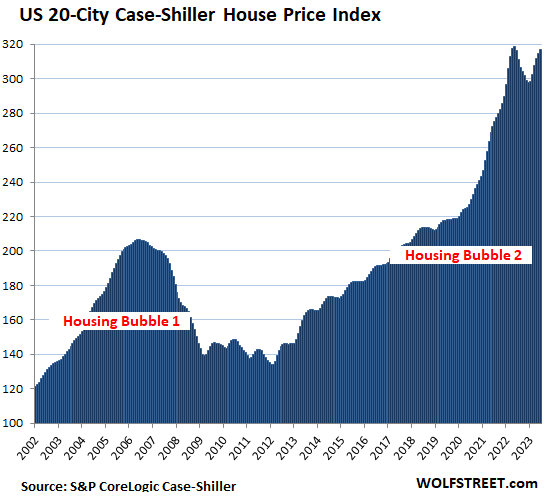
The S&P CoreLogic Case-Shiller Home Price Index, released today, for the 20 metros it covers ticked up 0.6% in July from June, the smallest month-to-month increase since February, continuing the trend of ever-smaller month-to-month increases following the powerful bounce in the spring, when three months in a row, the month-to-month jumps were 1.5% or higher.
Compared to the peak in June 2022, the index was down 0.6%. Year-over-year, the index was essentially flat.
Today’s index for “July” is a three-month moving average of home prices whose sales were entered into public records in May, June, and July. That’s the time frame we’re looking at here.
Prices were down from their peaks in 2022 in 10 of the 20 metros in the index (% from peak):
- San Francisco Bay Area: -10.8%
- Seattle: -10.1%
- Las Vegas: -7.2%
- Phoenix: -6.7%
- Portland: -4.5%
- Denver: -4.3%
- Dallas: -4.1%
- San Diego: -2.5%
- Los Angeles: -1.7%
- Tampa: -0.8%
Prices set new highs in 10 of the 20 metros in the index (% YoY):
- Chicago: +4.4%
- Cleveland: +4.0%
- New York: +3.8%
- Detroit: +3.2%
- Atlanta: +2.2%
- Washington DC: +1.9%
- Miami: +1.9%
- Charlotte: +1.8%
- Boston: +1.3%
- Minneapolis: +1.0%
The most splendid housing bubbles by metro.
San Francisco Bay Area:
- Month to month: +0.1%, unchanged for three months
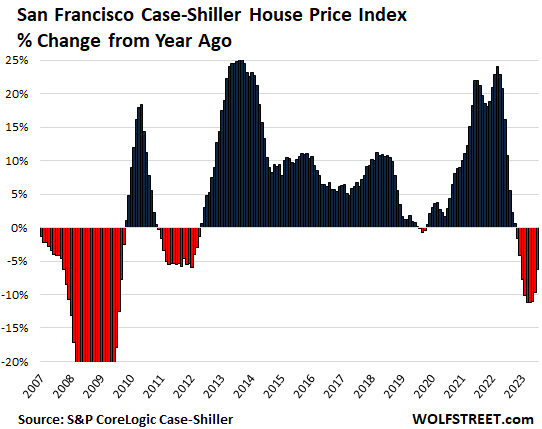
- Year over year: -6.2%.
- From the peak in May 2022: -10.8%.
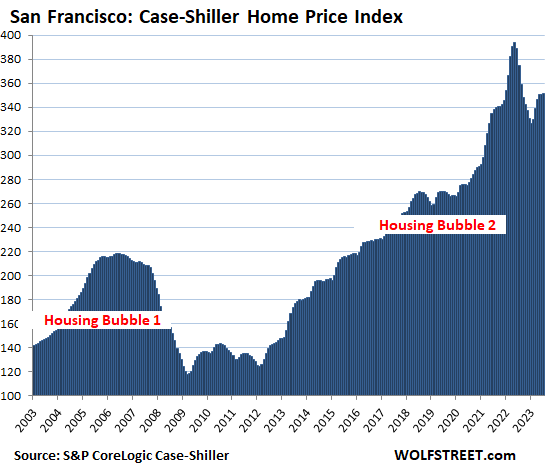
This was the 9th month in a row of year-over-year declines. Note how during Housing Bust 1 the waves of declines were interrupted by year-over-year increases:
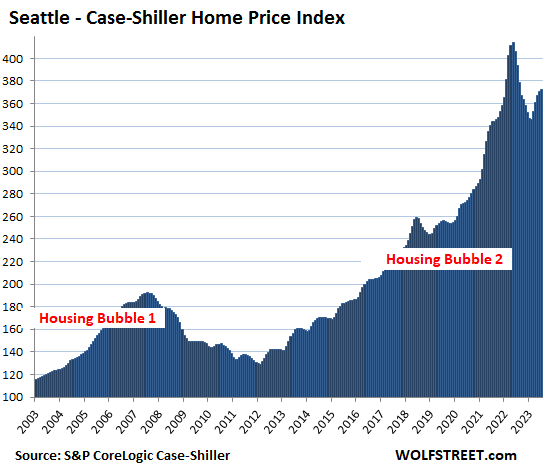
Seattle metro:
- Month to month: +0.5%.
- Year over year: -5.5%.
- From the peak in May 2022: -10.1%.
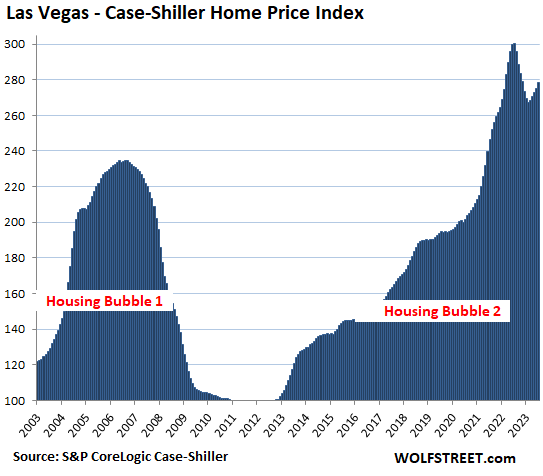
Las Vegas metro:
- Month to month: +1.1%.
- Year over year: -7.2%.
- From the peak in July 2022: -7.2%.
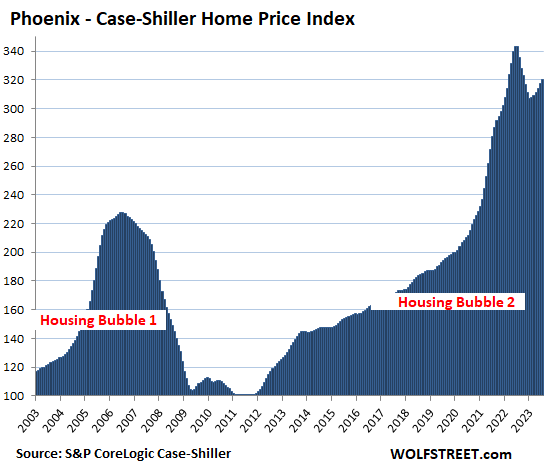
Phoenix metro:
- Month to month: +0.9%.
- Year over year: -6.6%.
- From the peak in June: -6.7%.
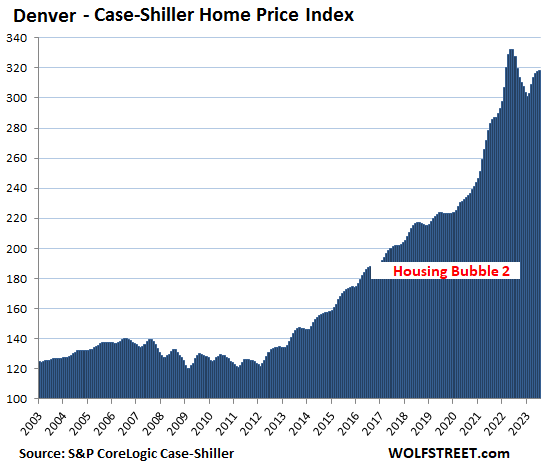
Denver metro:
- Month to month: +0.2%.
- Year over year: -2.8%.
- From the peak in May 2022: -4.3%.
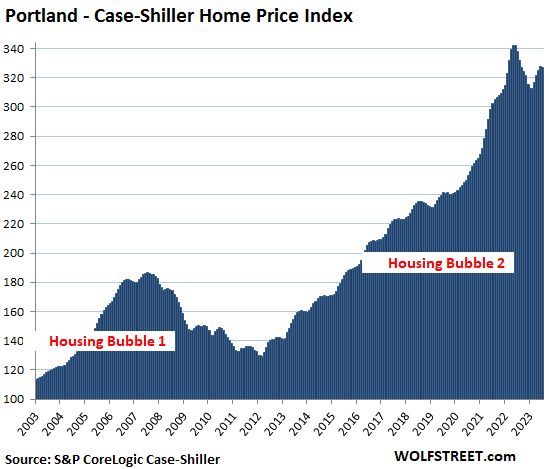
Portland metro:
- Month to month: -0.2%.
- Year over year: -3.3%.
- From the peak in May 2022: -4.5%.
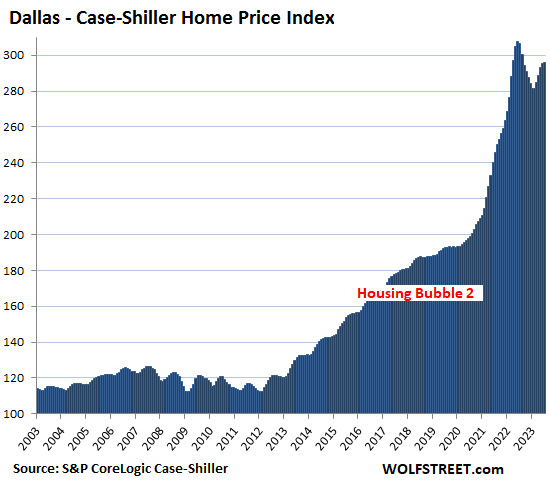
Dallas metro:
- Month to month: +0.3%.
- Year over year: -3.4%.
- From the peak in June 2022: -4.1%.
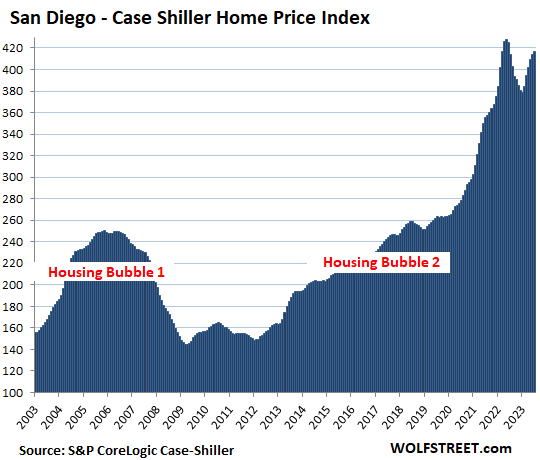
San Diego metro:
- Month to month: +0.7%.
- Year over year: +0.7%.
- From the peak in May 2022: -2.5%.
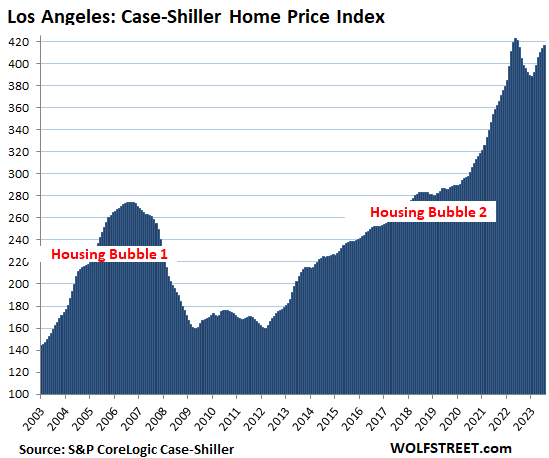
Los Angeles metro:
- Month to month: +0.6%.
- Year over year: +0.4%.
- From the peak in May 2022: -1.7%.
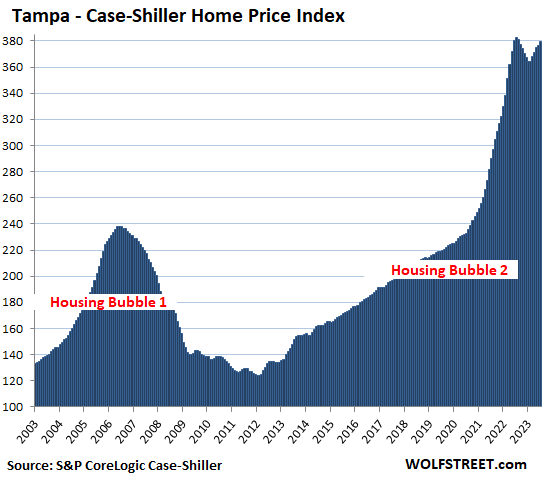
Tampa metro:
- Month to month: +0.7%.
- Year over year: -0.8%.
- From peak in July 2022: -0.8%
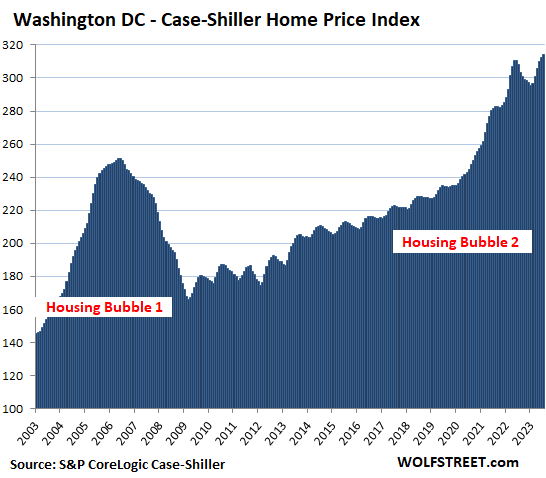
Washington D.C. metro:
- Month to month: +0.6%.
- Year over year: +1.9%.
- Set new high.
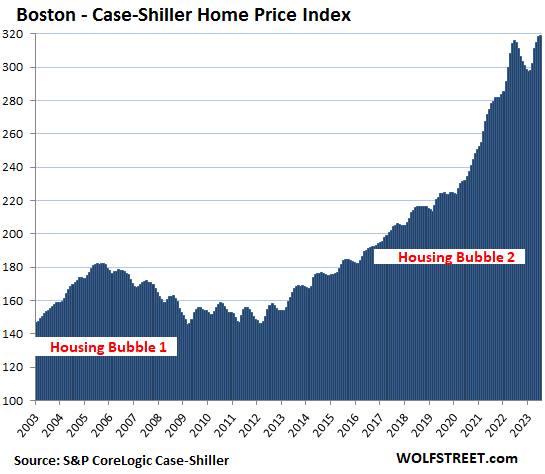
Boston metro:
- Month to month: +0.1%.
- Year over year: +1.3%.
- Eked out new high.
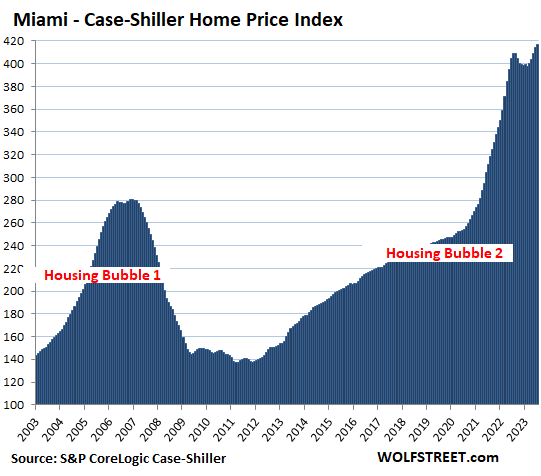
Miami metro:
- Month to month: +0.7%
- Year over year: +1.9%.
- Set new high.
New York metro:
- Month to month: +0.8%.
- Year over year: +3.8%.
- Set new high.
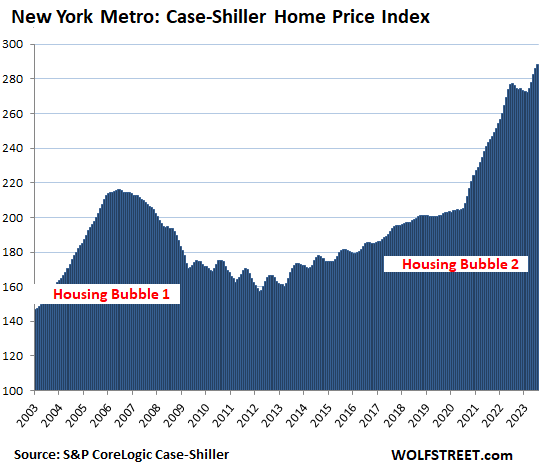
The Case-Shiller indices were set at 100 for the year 2000. This means that the index values of 417 today for Miami and San Diego are up by 317% since 2000, making those two metros the #1 Most Splendid Housing Bubbles in terms of price increases since 2000, followed by Los Angeles (+316%).
Methodology. The Case-Shiller Index uses the “sales pairs” method, comparing sales in the current month to when the same houses sold previously. The price changes are weighted based on how long ago the prior sale occurred, and adjustments are made for home improvements and other factors. This “sales pairs” method makes the Case-Shiller index a more reliable indicator than median price indices, but it lags months behind.
It’s Home-Price Inflation. By measuring how many dollars it takes to buy the same home over time, the Case-Shiller index is a measure of home price inflation. In my discussions of CPI inflation, I compare the Case-Shiller index to the CPI for Owners Equivalent of Rent, which shows the stunning distortions between home-price inflation and rent inflation (here, scroll down to the housing CPI section).
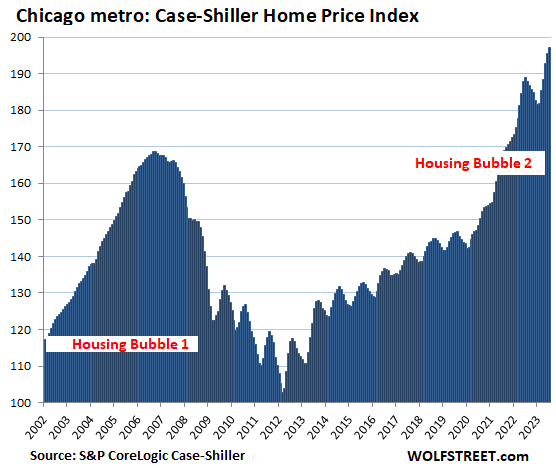
The remaining 6 of the 20 markets in the Case-Shiller index (Chicago, Charlotte, Minneapolis, Atlanta, Detroit, and Cleveland) had far less house price inflation since 2000, and don’t qualify for this list of the Most Splendid Housing Bubbles.
The Chicago metro still doesn’t qualify for this list, with an index value of 197, which is up by “only” 97% from 2000, and 91 points below the lowest-ranked metro of the Most Splendid Housing Bubbles, New York (index value = 288). But prices are on a roll in the Chicago metro. So here it is anyway:
- Month to month: +0.8%.
- Year over year: +4.4%
- Set new high.
Enjoy reading WOLF STREET and want to support it? You can donate. I appreciate it immensely. Click on the beer and iced-tea mug to find out how:

Would you like to be notified via email when WOLF STREET publishes a new article? Sign up here.
![]()
[ad_2]
Source link