Gold refreshes three-week high on fears of wider Middle East conflict, sliding US bond yields
- Gold price prolongs its recent uptrend and rallies to a near three-month high on Friday.
- Geopolitical risks continue to drive haven flows and remain supportive of the move.
- Elevated US bond yields and a stronger USD might cap gains amid the overbought RSI.
Gold price (XAU/USD) advances to a three-month top, around the $1,985 area on Friday and remains well supported by the global flight to safety, bolstered by concerns over geopolitical tensions in the Middle East. Apart from this, growing acceptance that the Federal Reserve (Fed) will keep interest rates unchanged for the second straight time in November is seen as another factor that pushes the non-yielding yellow metal higher for the fourth successive day. This also marks the fifth day of a positive move in the previous five and is further supported by retreating US Treasury bond yields.
In fact, the yield on the benchmark 10-year US government bond pulls back from a fresh 16-year peak touched on Thursday, though remains close to the 5% threshold. This, along with the overbought Relative Strength Index (RSI) on hourly charts, warrants some caution for bullish traders and positioning for any further appreciating move for the US Dollar-denominated commodity. Nevertheless, the metal seems poised to register strong gains for the second straight week as traders now look foward to comments by influential FOMC members for short-term opportunities on the last day of the week.
Daily Digest Market Movers: Gold price scales higher for the fourth successive day
- Concerns that the Israel-Hamas war could spill over to other Middle Eastern nations and impact the world economy continue to benefit the safe-haven Gold price.
- Israel pounded the Gaza Strip with airstrikes on Thursday and appeared to be getting closer to a full-scale invasion of the seaside enclave ruled by Hamas.
- The Israeli military massed troops and equipment near the Gaza border, while the Israeli missiles also struck targets in Lebanon and Syria.
- Egypt has also been directly affected by the escalation in the conflict, with Israel repeatedly bombing the Rafah border crossing between Egypt and Gaza.
- Federal Reserve Chairman Jerome Powell said that additional interest rate hikes could be warranted in view of economic resiliency and labor market tightness.
- The benchmark 10-year US Treasury bond yield touches a fresh 16-year high on Thursday and assists the US Dollar in attracting some dip-buying on Friday.
- Elevated US bond yields, a modest USD strength, along with overbought conditions on hourly charts, might keep a lid on any further gains for the XAU/USD.
Technical Analysis: Gold price extends its steady ascent and now looks to $2,000 mark
From a technical perspective, this week’s break above the 200-day SMA and a subsequent move beyond the $1,947-1,948 supply zone favour bullish traders. That said, the Relative Strength Index (RSI) on hourly charts is flashing overbought conditions and makes it prudent to wait for some near-term consolidation before the next leg up. Nevertheless, the Gold price seems poised to surpass the July swing high, around the $1,987 region, and aim to conquer the $2,000 psychological mark for the first time since May.
On the flip side, any meaningful corrective decline now seems to find decent support and attract fresh buyers near the $1,947-1,948 resistance breakpoint. This should help limit the downside near the 200-day SMA, currently pegged around the $1,930 zone. A convincing break below, however, might prompt some technical selling and drag the Gold price to the weekly low, around the $1,908 region en route to the $1,900 round figure. The latter coincides with the 50-day SMA support and should act as a strong base for the XAU/USD.
US Dollar price today
The table below shows the percentage change of US Dollar (USD) against listed major currencies today. US Dollar was the weakest against the Canadian Dollar.
| USD | EUR | GBP | CAD | AUD | JPY | NZD | CHF | |
| USD | 0.09% | 0.01% | -0.04% | 0.07% | 0.01% | 0.13% | 0.04% | |
| EUR | -0.09% | -0.10% | -0.13% | -0.02% | -0.07% | 0.03% | -0.04% | |
| GBP | 0.01% | 0.10% | -0.03% | 0.08% | 0.03% | 0.14% | 0.07% | |
| CAD | 0.03% | 0.15% | 0.02% | 0.14% | 0.06% | 0.18% | 0.10% | |
| AUD | -0.08% | 0.02% | -0.07% | -0.11% | -0.04% | 0.05% | -0.01% | |
| JPY | -0.01% | 0.07% | -0.03% | -0.08% | 0.06% | 0.10% | 0.03% | |
| NZD | -0.15% | -0.05% | -0.15% | -0.17% | -0.07% | -0.09% | -0.08% | |
| CHF | -0.06% | 0.03% | -0.07% | -0.10% | 0.01% | -0.03% | 0.08% |
The heat map shows percentage changes of major currencies against each other. The base currency is picked from the left column, while the quote currency is picked from the top row. For example, if you pick the Euro from the left column and move along the horizontal line to the Japanese Yen, the percentage change displayed in the box will represent EUR (base)/JPY (quote).
Economic Indicator
United States Fed’s Harker speech
Patrick T. Harker took office on July 1, 2015, as the eleventh president and chief executive officer of the Third District Federal Reserve Bank, at Philadelphia. In 2016, he serves as an alternate voting member of the Federal Open Market Committee.
Read more.
Next release: 10/20/2023 13:00:00 GMT
Frequency: Irregular
Source: Federal Reserve
[ad_2]
Source link
Analysis-Cash-strapped countries face IMF bailout delays as debt talks drag on
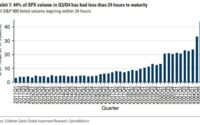
JPMorgan’s Kolanovic Warns of ‘Volmageddon 2.0’ Risk in Options