Gold is officially outperforming stocks in 2023 as October rally continues
By Joseph Adinolfi
It’s official: gold is officially outperforming the S&P 500 stock index in 2023 due to an October rally that has brought the price of an ounce of the yellow metal to the cusp of the $2,000 mark, a level it hasn’t seen since May.
Metals traders attributed gold’s gains to a surge in demand for hedges and safety plays following Hamas’s Oct. 7 attack on Israel, which provoked a war between Israel and the group that is deemed a terrorist organization by the U.S. and European Union.
See: Forget stocks! Gold enjoys a moment over the past year as it hurtles toward $2,000
“The brutal Hamas attack on Israel sent shock waves around the world — and sent the price of gold soaring,” said Brien Lundin, editor of Gold Newsletter, in a monthly outlook shared with MarketWatch.
As of Thursday’s close, the S&P 500 SPX had gained 7.8% since Jan. 1, while front-month gold futures have gained 9.2% during the same period, according to Dow Jones Market Data.
Gold (GC00) futures for October delivery, the current front-month contract, gained $3.10 per troy ounce, or 0.16% to $1987.20 on Thursday, its highest settlement value since May 16, according to FactSet data. Since the start of October, it has risen more than 7.5%.
By comparison, the S&P 500 is down 3.5% month-to-date as it heads for a third straight month in the red. If it finishes October in the red, it would mark the first time the large-cap index has fallen for three consecutive months since March 2020, FactSet data show.
Gold also outperformed stocks in 2022. While front-month futures finished the year marginally lower, the losses were much more modest than the 19.4% drop in the S&P 500, a figure that excludes dividends. Gold also outperformed stocks in 2020, when gold futures rose 24.4% compared with the S&P 500’s 16.3% gain.
As of Thursday’s close, the S&P 500 has fallen 9.8% from its 2023 closing high of 4588.96 from July 31. That leaves it just outside of correction territory, which is defined as a drop of 10% or more from a recent high.
The index has fallen 2.6% over the past two trading days, its largest two-day decline since March 10, according to Dow Jones data. On that day, Silicon Valley Bank collapsed, sending tremors through markets.
Gold’s outperformance compared with stocks looks even more notable when measured against the equal-weighted version of the S&P 500 XX:SP500EW.45, which is down 4.3% year-to-date, according to FactSet data.
-Joseph Adinolfi
This content was created by MarketWatch, which is operated by Dow Jones & Co. MarketWatch is published independently from Dow Jones Newswires and The Wall Street Journal.
(END) Dow Jones Newswires
10-26-23 1710ET
Copyright (c) 2023 Dow Jones & Company, Inc.
[ad_2]
Source link
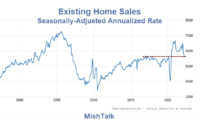
Existing Home Sales Skid to Pre-Pandemic Level, a Housing Bust is Underway – Mish Talk

US Treasury’s $1 trillion borrowing drive set to put banks under strain