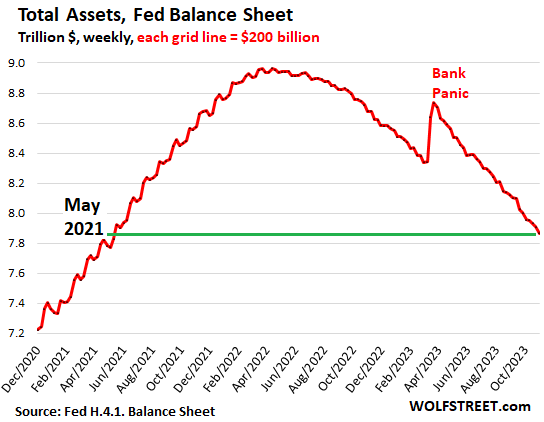
Fed Balance Sheet QT: -$1.1 Trillion from Peak, to $7.87 Trillion, Lowest since May 2021.
Fed shed 26.5% of Treasuries it had added during pandemic QE.
By Wolf Richter for WOLF STREET.
The Fed’s Quantitative Tightening (QT) and the unwinding of the bank-panic liquidity measures continue on track: Total assets on the Fed’s balance sheet dropped by $89 billion in October, to $7.87 trillion, the lowest since May 2021, according to the Fed’s weekly balance sheet today.
Since peak-QE in April 2022, total assets have dropped by $1.10 trillion. The close-up view:
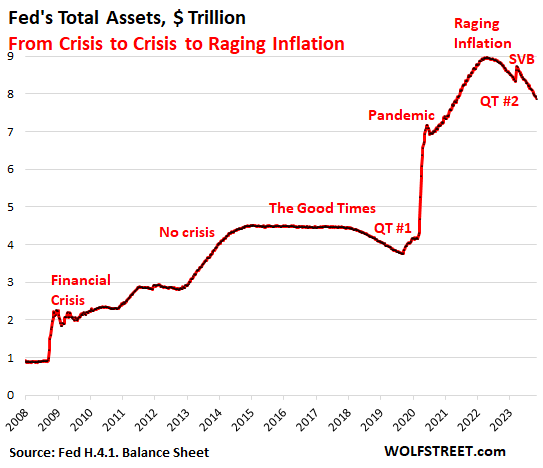
From crisis to crisis to raging inflation:
During this $1.1 trillion drop in assets under QT #2, inflation has backed off from its rage in 2022, but it’s still nearly twice the Fed’s target.
By contrast, during QT #1 between November 2017 and August 2019, when the Fed’s total assets dropped by $688 billion, inflation was below or at the Fed’s target (1.8% core PCE in August 2019), and the Fed was just trying to “normalize” its balance sheet.
But now there’s a lot of inflation still, and the QE asset-pile ballooned when the Fed went hog-wild during the pandemic, and now there’s a lot more to take off the pile. The long view:
QT on track.
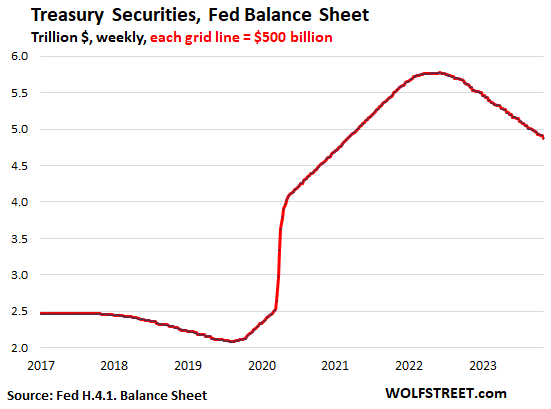
Treasury securities: -$58 billion in October, -$899 billion from peak in June 2022, to $4.87 trillion, the lowest since March 2021.
The Fed has shed 27.5% of the $3.27 trillion in Treasury securities it had piled on during pandemic-QE.
Treasury notes (2- to 10-year securities) and bonds (20- & 30-year securities) “roll off” the balance sheet mid-month or at the end of the month when they mature and the Fed gets paid face value for them. The roll-off is capped at $60 billion per month, and about that much has been rolling off, minus the inflation protection the Fed earns on Treasury Inflation Protected Securities (TIPS) which is added to the principal of the TIPS.
Why Treasury bills are important for QT. These short-term securities (1 month to 1 year) are included in the overall Treasury securities of $4.87 trillion on the Fed’s balance sheet.
They show us when the roll-off of notes and bonds falls short of the $60-billion monthly cap, because T-bills are then used to make up the difference. And when the Fed runs out of T-bills, the Treasury roll-off will fall below the $60 billion cap.
There were only three months this year – February, May, and August – when the roll-off of notes and bonds exceeded the $60 billion monthly cap, so the roll-off was capped at $60 billion.
In the other seven months this year, the roll-off of notes and bonds was below the cap, and T-bills were used to make up the difference. In October, $7 billion of T-bills were used for this purpose.
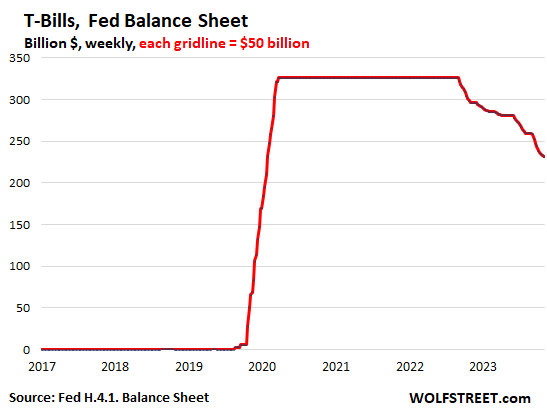
From March 2020 through the ramp-up of QT, the Fed held $326 billion in T-bills that it constantly replaced as they matured by buying new T-bills at auctions. This is evidenced by the flat line in the chart below.
In September 2022, T-bills first started rolling off as needed to top off the Treasury roll offs.
On the current balance sheet, T-bills are down to $231 billion, with the other $95 billion in T-bills having by now been used to top off the Treasury roll-off.
The stash of T-bills on the balance sheet tells us that the Fed will hit the $60 billion cap each month. Once that stash is gone, the roll-off of Treasuries will then mostly not reach the $60 billion cap.
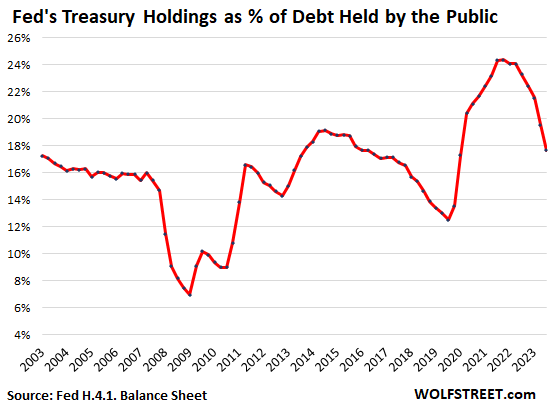
The Fed’s weight in the Treasury market: The Fed now holds 17.7% of marketable Treasury securities held by the public, down from over 24% at the peak. The sharp drop in the percentage is a result of two factors: One, the QT drop in Treasury securities on the Fed’s balance sheet; and two, the ballooning marketable securities issued to fund the gigantic deficit.
In other words, the Fed still plays a big role in the bond market, but that role is rapidly declining in relative terms:
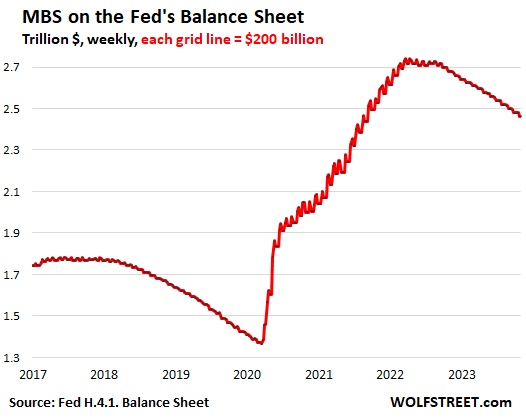
Mortgage-Backed Securities: -$17 billion in October, -$277 billion from the peak, to $2.46 trillion, the lowest since September 2021.
The Fed only holds government-backed MBS, and taxpayers carry the credit risk. MBS come off the balance sheet primarily via pass-through principal payments that holders receive when mortgages are paid off (mortgaged homes are sold, mortgages are refinanced) and when mortgage payments are made.
The spike in mortgage rates has caused refis to collapse and home sales to plunge which slowed the mortgage payoffs, and therefore the pass-through principal payments, with the MBS run-off between $15 billion and $21 billion a month, far below the $35-billion cap.
Bank-panic liquidity pile unwinds.
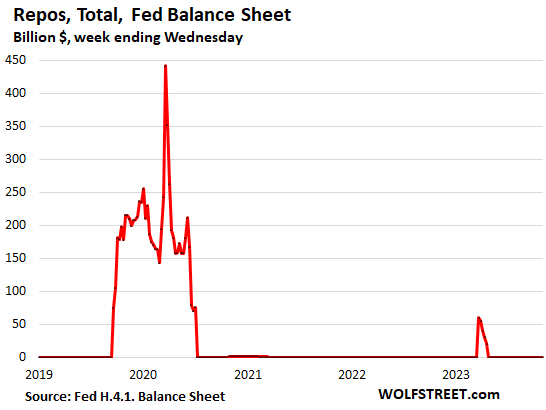
Repos come in two flavors, both $0 now. Repos with “foreign official” counterparties – likely the Swiss National Bank in its efforts to backstop the take-under of Credit Suisse by UBS – were paid off in April. At the peak in March 2023, they reached $60 billion.
The normal repos with US counterparties faded out in July 2020, when the Fed made the terms less attractive. The Fed currently charges 5.5% on repos, as part of its policy rates, which it left unchanged yesterday, and there are no takers at these rates. But there were lots of takers during the crisis in March through June 2020, and when the repo market blew out in late 2019. That’s the big bulge in the chart below.
The little bulge in early 2023 were the repos with foreign official counterparties.
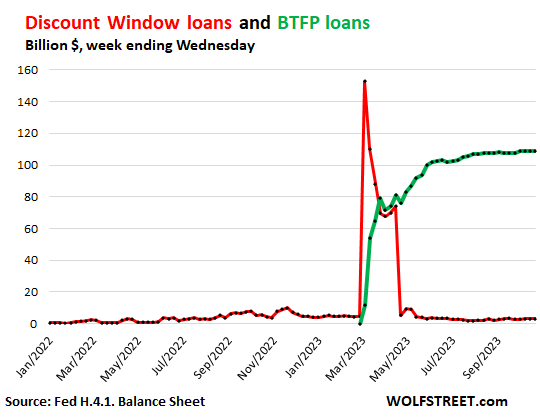
Discount Window: roughly unchanged in October, at the near-nothing level of $2.9 billion, compared to $153 billion in bank-panic March (red line in the chart below).
Discount Window lending to banks is as old as the Fed. The Fed currently charges banks 5.5% to borrow at the discount window, and banks have to post collateral under strict conditions and at “fair market value.” Banks pay off these expensive Discount Window loans as soon as they can.
Bank Term Funding Program (BTFP): ticked up by $1.4 billion in October to $109 billion (green line in the chart below).
The BTFP, created during the bank panic, is less punitive and more flexible than the Discount Window. Banks can borrow for up to one year, at a fixed rate, pegged to the one-year overnight index swap rate plus 10 basis points. The collateral is valued at purchase price rather than at the lower market price.
This facility is small compared to the $22.8 trillion in commercial bank assets held by the 4,100 commercial banks in the US.
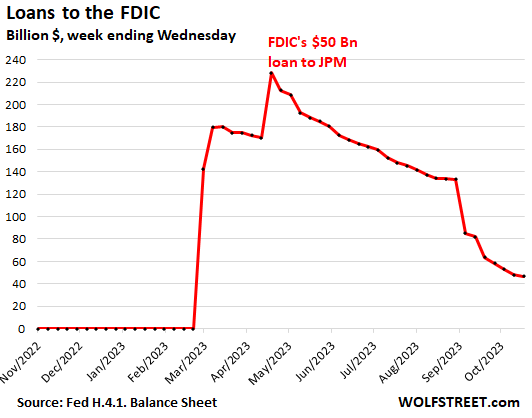
Loans to FDIC: -$16 billion in October, to $47 billion.
The FDIC has been selling the assets it took on with the takedowns of Silicon Valley Bank, Signature Bank, and First Republic. After the asset sales close, the FDIC sends the proceeds from the sales to the Fed to pay down the loan balance. The FDIC also issued a $50 billion loan to JPMorgan to fund part of the First Republic liabilities that JPMorgan took on.
Enjoy reading WOLF STREET and want to support it? You can donate. I appreciate it immensely. Click on the beer and iced-tea mug to find out how:

Would you like to be notified via email when WOLF STREET publishes a new article? Sign up here.
![]()
[ad_2]
Source link
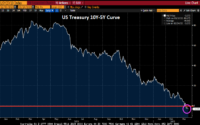
Inversion! US Treasury 10Y-5Y Curve Inverts As Investors Flee Treasury Market As Mortgage Rates Hit 4.42% – Confounded Interest
We’re Still In A Bear Market Rally