Suddenly Here Comes the Inventory: Homes Listed for Sale Jump amid Price Reductions and Sagging Sales
The shadow inventory emerges with perfect timing, just as holy-moly mortgage rates and sky-high prices keep buyers away.
By Wolf Richter for WOLF STREET.
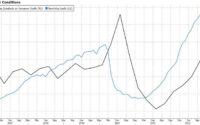
“Inventory” in housing means homes listed for sale. Then there’s the shadow inventory – vacant homes that owners want to sell eventually because they have already moved into a new place but want to ride up the surge in home prices all the way, and then at the tippy-top, they’ll sell it to maximize their profits.
We have seen this during the past 18 months when home prices spiked: people bought a home and moved in, and they moved out their other home, but didn’t sell it, expecting a 10% or 20% or 30% gain in price on a leveraged bet with a much bigger gain on equity. The math makes sense, though it doesn’t always work out, and now it’s starting to be time to put those vacant homes on the market, and here they come, just as home sales are dropping because layers and layers of buyers have been removed from the market by the rising mortgage rates and sky-high prices.
Active listings jumped. In May, inventory of homes actively listed for sale jumped by 26% from April and are suddenly up by 8% from a year ago, the first year-over-year increase since June 2019, according to the National Association of Realtors today. There were about 38,000 more homes listed for sale in May than a year ago (data via realtor.com):
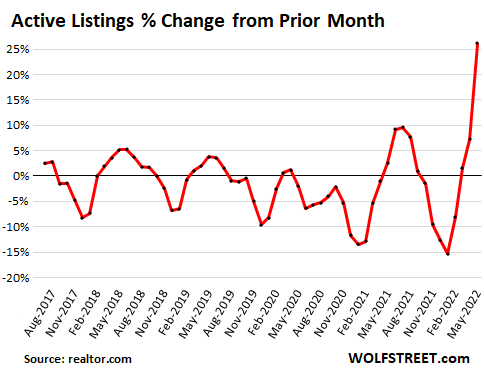
The strategy of not putting the old home on the market after moving out has had the effect of creating record low inventories for sale, and inventories remain low, but that is now changing, and very suddenly so.
Active listings jumped for two reasons:
One, falling sales, as potential buyers left the market due to sky-high home prices and holy-moly mortgage rates. The NAR’s metric of “pending listings” for May, which tracks listings that are in various stages of the sales process, but before the deal closes, dropped by 12.6% year-over-year in May, after the 8.7% drop in April, the ninth month in a row of year-over-year declines:
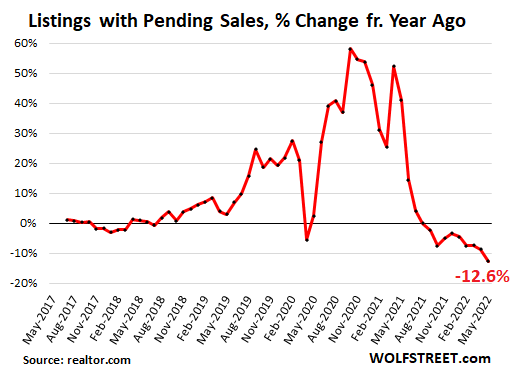
Reported later in the month, closed sales have also dropped for the ninth month in a row, and the closed sales data for May should be another doozie.
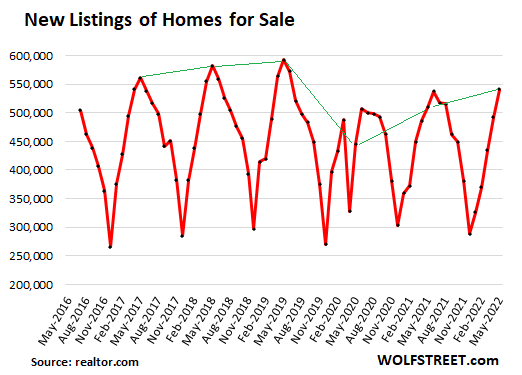
And two, the suddenly surging number of new listings in May. New listings jumped by 10% in May from April, and are now up 6.3% from May last year, the second month in a row of year-over-year increases, after April at 1.3% year-over-year. The 541,000 homes newly listed for sale in May was the largest number of new listings since June 2019.
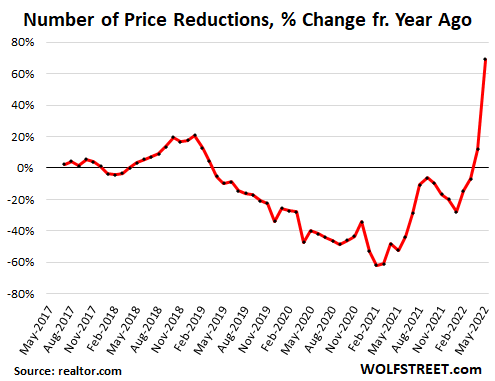
Price reductions jumped by 74% in May from April, and by 69% from May last year, in a sudden and massive U-turn from the very low levels last year and earlier this year:
Huge differences among the 50 largest metros.
Among the largest 48 metros (data for Oklahoma City and Hartford were excluded due to “data inconsistencies,” the NAR said), the number of active listings in May jumped the most on a year-over-year basis in Austin (+85.8% from May last year); and fell the most in Miami (-32.1% from May last year).
Among the 48 metros, active listings fell in only six of them as homeowners there apparently haven’t got the memo yet.
Among the 48 metros, active listings surged by the double digits year-over-year in half of them (24).
The table is sorted by the year-over-year % change of active listings:
| Metro, listings in May 2022 |
Active Listings, % Change YoY | New Listings, % Change YoY |
| Austin-Round Rock, Texas | 85.8% | 19.1% |
| Phoenix-Mesa-Scottsdale, Ariz. | 67.1% | 13.7% |
| Sacramento–Roseville–Arden-Arcade, Calif. | 54.6% | 5.6% |
| Riverside-San Bernardino-Ontario, Calif. | 51.6% | 6.3% |
| Denver-Aurora-Lakewood, Colo. | 49.6% | 16.5% |
| San Antonio-New Braunfels, Texas | 44.1% | 9.5% |
| Raleigh, N.C. | 41.6% | 27.9% |
| Seattle-Tacoma-Bellevue, Wash. | 38.8% | 17.9% |
| Nashville-Davidson–Murfreesboro–Franklin, Tenn. | 38.1% | 22.8% |
| Tampa-St. Petersburg-Clearwater, Fla. | 35.5% | 11.2% |
| Dallas-Fort Worth-Arlington, Texas | 34.4% | 18.0% |
| San Francisco-Oakland-Hayward, Calif. | 32.5% | 2.5% |
| Kansas City, Mo.-Kan. | 24.4% | -2.5% |
| San Jose-Sunnyvale-Santa Clara, Calif. | 22.9% | 3.2% |
| Jacksonville, Fla. | 22.5% | 8.4% |
| Memphis, Tenn.-Miss.-Ark. | 21.4% | 5.0% |
| Charlotte-Concord-Gastonia, N.C.-S.C. | 21.1% | 17.0% |
| Detroit-Warren-Dearborn, Mich. | 19.8% | 2.1% |
| Portland-Vancouver-Hillsboro, Ore.-Wash. | 19.2% | 3.0% |
| Louisville/Jefferson County, Ky.-Ind. | 19.1% | -1.3% |
| Las Vegas-Henderson-Paradise, Nev. | 18.6% | 20.7% |
| Indianapolis-Carmel-Anderson, Ind. | 14.2% | 11.2% |
| Birmingham-Hoover, Ala. | 12.5% | 3.5% |
| Atlanta-Sandy Springs-Roswell, Ga. | 10.6% | 2.2% |
| San Diego-Carlsbad, Calif. | 9.8% | -6.9% |
| New Orleans-Metairie, La. | 8.6% | -2.6% |
| Columbus, Ohio | 7.2% | -4.5% |
| Buffalo-Cheektowaga-Niagara Falls, N.Y. | 6.6% | 1.0% |
| Orlando-Kissimmee-Sanford, Fla. | 6.6% | 10.3% |
| Los Angeles-Long Beach-Anaheim, Calif. | 5.1% | -3.4% |
| Pittsburgh, Pa. | 4.6% | -1.5% |
| St. Louis, Mo.-Ill. | 4.4% | -2.1% |
| Houston-The Woodlands-Sugar Land, Texas | 4.3% | 4.5% |
| Philadelphia-Camden-Wilmington, Pa.-N.J.-Del.-Md. | 4.1% | 4.9% |
| Cincinnati, Ohio-Ky.-Ind. | 2.7% | 5.0% |
| Minneapolis-St. Paul-Bloomington, Minn.-Wis. | 2.4% | -0.7% |
| Baltimore-Columbia-Towson, Md. | 2.3% | -7.3% |
| Providence-Warwick, R.I.-Mass. | 2.1% | -5.8% |
| Washington-Arlington-Alexandria, DC-Va.-Md.-W. Va. | 1.5% | -5.5% |
| Rochester, N.Y. | 0.9% | 5.6% |
| Milwaukee-Waukesha-West Allis, Wis. | 0.7% | -5.3% |
| New York-Newark-Jersey City, N.Y.-N.J.-Pa. | -0.8% | 0.8% |
| Cleveland-Elyria, Ohio | -1.2% | -9.3% |
| Boston-Cambridge-Newton, Mass.-N.H. | -6.9% | -2.2% |
| Chicago-Naperville-Elgin, Ill.-Ind.-Wis. | -14.8% | -10.0% |
| Richmond, Va. | -15.3% | -7.8% |
| Virginia Beach-Norfolk-Newport News, Va.-N.C. | -19.3% | -15.1% |
| Miami-Fort Lauderdale-West Palm Beach, Fla. | -32.1% | -0.4% |
Enjoy reading WOLF STREET and want to support it? Using ad blockers – I totally get why – but want to support the site? You can donate. I appreciate it immensely. Click on the beer and iced-tea mug to find out how:

Would you like to be notified via email when WOLF STREET publishes a new article? Sign up here.
![]()
[ad_2]
Source link

Inflation Is Just the Beginning. А Few Words about how the State Multiplies Risks.

CBDC Means Central Bank DIRECT Control (Central Bank Digital Currency Is Frought With Moral Hazard Risks) – Confounded Interest – Anthony B. Sanders